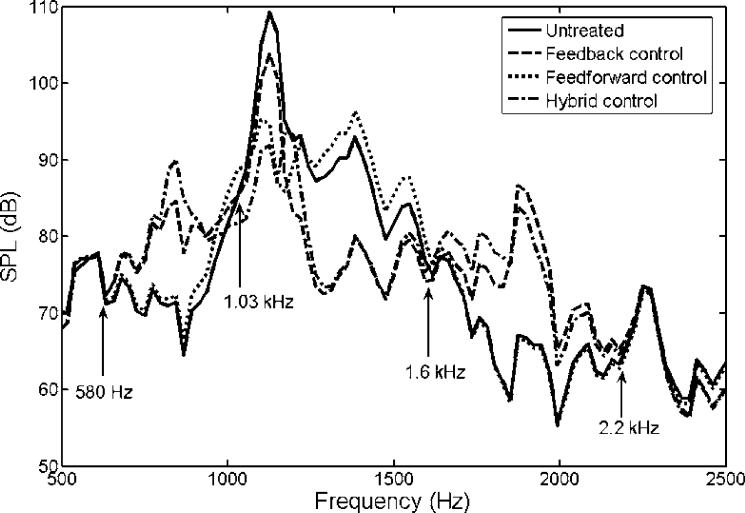
Figure 8.
Spectrum of untreated MRI noise ( ), treated acoustic signal after applying feedback control only (
 ), treated acoustic signal after applying feedforward control only (
 ) and treated acoustic signal after applying hybrid control (
 ). Note that the response in the two frequency ranges, 580 Hz ∼ 1.03 kHz and 1.6 kHz ∼ 2.2 kHz, are increased slightly after applying control.

