
Figure 4.
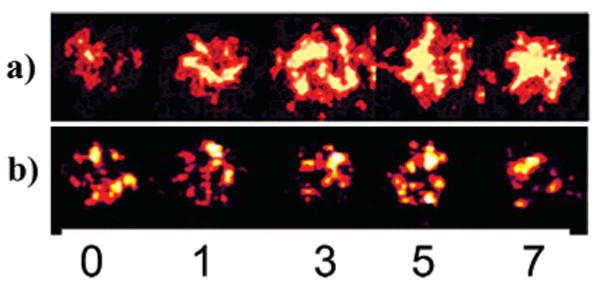
Comparison of ECL response of RuPVP/DNA/enzyme spots containing cyt P450 1B1 after denoted exposure time (min) to 0.5 mM H2O2 + 100 μM B[a]P (a) without and (b) with the addition of 30 μM inhibitor αNF.
Official websites use .gov
A
.gov website belongs to an official
government organization in the United States.
Secure .gov websites use HTTPS
A lock (
) or https:// means you've safely
connected to the .gov website. Share sensitive
information only on official, secure websites.
Comparison of ECL response of RuPVP/DNA/enzyme spots containing cyt P450 1B1 after denoted exposure time (min) to 0.5 mM H2O2 + 100 μM B[a]P (a) without and (b) with the addition of 30 μM inhibitor αNF.