Figure 6.

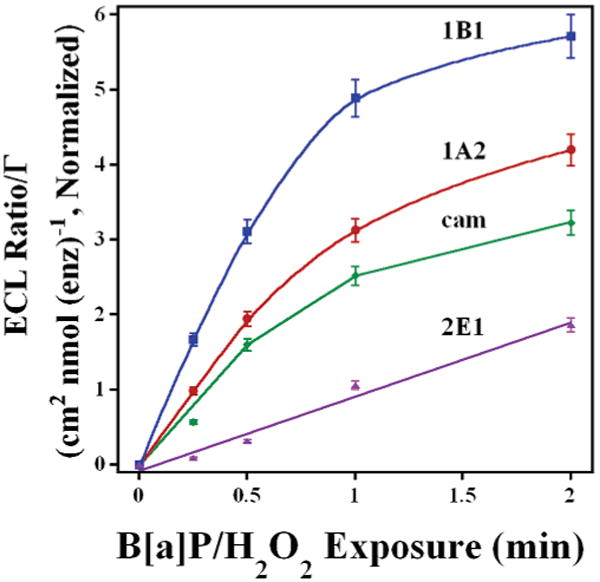
Influence of B[a]P/H2O2 exposure time for cyt P450 enzymes located on same array. ECL ratio was normalized for amount of enzyme. Cyt P450s used were 1B1(blue), 1A2 (red), cam (green), and 2E1 (purple).

Influence of B[a]P/H2O2 exposure time for cyt P450 enzymes located on same array. ECL ratio was normalized for amount of enzyme. Cyt P450s used were 1B1(blue), 1A2 (red), cam (green), and 2E1 (purple).