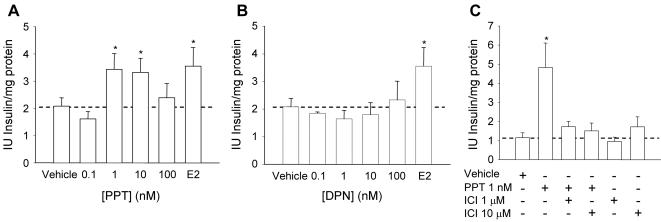
Figure 5. Action of ERα and ERβ agonists on insulin content.
(A) Insulin content of islets cultured for 48 hours in the presence of increasing doses of the ERα-selective agonist PPT. The bar labeled E2 represents islets cultured with 1 nM E2 for 48 hours. Note that PPT increases insulin content in an inverted-U dependent manner and its potency is in the same range as E2 (n = 5, 7 mice), * p<0.05. (B) The ERβ-selective agonist DPN has no effect at doses from 0.1–100 nM. The bar labeled E2 represents islets cultured with 1 nM E2 for 48 hours (n = 4, from at least 5 mice), * p<0.05. (C) Insulin content regulation by PPT in the presence and absence of ICI182,780 (n = 4, from at least 6 mice), * p<0.05.

