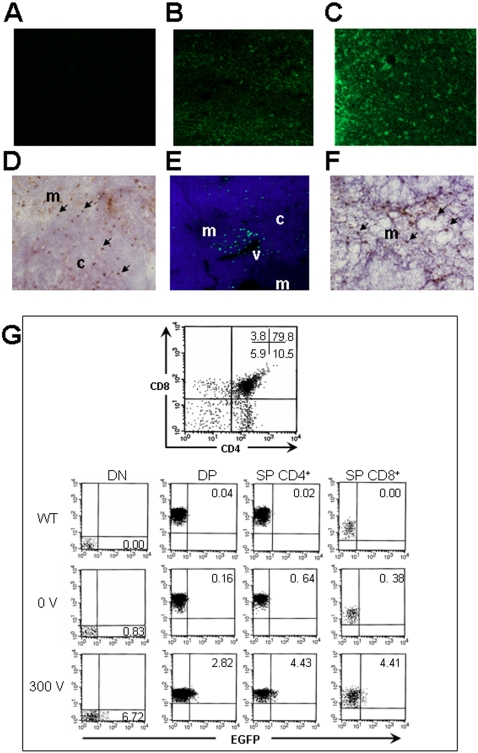
Figure 2. Distribution and immunophenotype of EGFP transfected thymocytes in electroporated thymi.
Sections of thymi that were: (A) non injected; (B) injected without electroporation after 24 hours and (C) electroporated at 300 V after 24 hours were analyzed for the EGFP expression signal by confocal microscopy. Each image was captured and processed under the same conditions with a 10X objective. (D) 20X view of immunohistochemistry analysis using an anti-EGFP antibody of a thymus electroporated with the EGFP DNA plasmid at 300 V after 24 hours. (E) After one month, a nuclear counterstain (DAPI, blue) shows that these transfected cells are localized around blood vessels near the cortico-medullary junction (CMJ). (F) 20X view of immunohistochemistry analysis using an anti-EGFP antibody shows numerous transfected cells in the medulla after one month. Arrows indicate the EGFP expression signal. Abbreviations: c = cortex, m = medulla, v = venule. (G) Thymocyte profile stained with CD4 and CD8 monoclonal antibodies was analyzed by flow cytometry after 24 hours thymic electroporation. The percentage of cells within each quadrant is indicated. The different populations of thymocytes expressing EGFP protein in wild-type, 0 V and 300 V electroporated thymus were analyzed. The percentage of EGFP transfected cells is indicated within the quadrant of each population.

