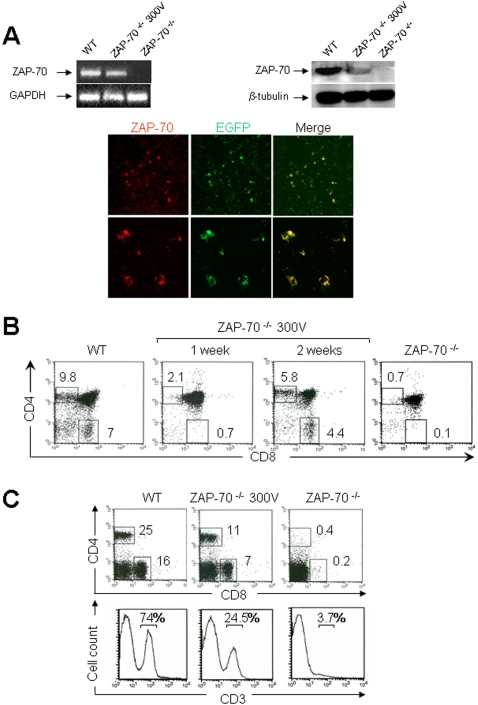
Figure 4. T cell reconstitution in ZAP-70-/- mice following in vivo thymic electroporation with the pCMV-ZAP-70-IRES-EGFP DNA plasmid.
(A) The upper panel shows ZAP-70 mRNA (left panel) and protein (right panel) levels in total thymocytes from WT, in vivo electroporated thymus at 300 V after 48 hours and in ZAP-70-/- deficient mice assessed by RT-PCR and western-blot, respectively. The lower panel shows the distribution of ZAP-70 and EGFP proteins analyzed 48 hours after in vivo electroporation of the pCMV-ZAP-70-IRES-EGFP DNA plasmid by confocal microscopy (upper panel, 100X view). A higher magnification of transfected thymocytes is also presented (400X view). (B) Thymocyte profiles stained with CD4 and CD8 monoclonal antibodies were analyzed in WT and ZAP-70-/- mice electroporated at 300 V with the pCMV-ZAP-70-IRES-EGFP DNA plasmid after one and two weeks as well as in ZAP-70-/- mice. (C) three weeks after thymic electroporation, the presence of splenic T cells was monitored using CD4 and CD8 monoclonal antibodies (upper panel). Percentages of CD4+ and CD8+ T lymphocytes from WT and reconstituted mice as well as ZAP-70-/- mice are indicated. The CD3+ T lymphocytes profile was also analyzed by using a CD3 monoclonal antibody (lower panel). The percentages of positively stained cells are indicated in each histogram.

