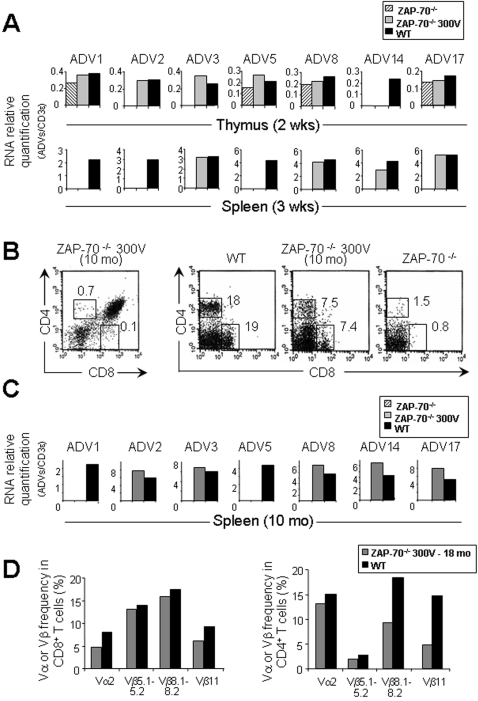
Figure 5. TCR repertoire diversity in ZAP-70-/- electroporated mice.
(A) Quantification of TCR V alpha transcripts in thymi and spleens between WT, untreated ZAP-70-/-, and ZAP-70-/- mice electroporated at 300 V. Two and three weeks after electroporation, thymic (upper panel) and splenic (lower panel) cDNAs were respectively amplified using oligonucleotides specific for CD3ε and for a set of oligonucleotides specific for each of the V alpha genes in conjunction with a primer specific of the constant region of TCR alpha chain. Histograms correspond to a representative amplification of two separate experiments. (B) Thymocyte profile stained with CD4 and CD8 monoclonal antibodies was analyzed by flow cytometry after 10 months thymic electroporation (left panel). The persistence of CD4 and CD8 T lymphocytes in the spleen was monitored by flow cytometry 10 month after thymic electroporation (right panel). (C) Quantification of TCR V alpha transcripts in spleens between WT, untreated ZAP-70-/-, and ZAP-70-/- mice with thymi electroporated at 300 V after 10 months. Splenic cDNA was amplified using oligonucleotides specific for CD3ε and for a set of oligonucleotides specific for each of the V alpha genes in conjunction with a primer specific of the constant region of TCR alpha chain. Histograms correspond to a representative amplification of two separate experiments. (D) TCRVα2 and indicated TCRVβ usage by splenic CD8 and CD4 T cells was evaluated by FACS analysis in eighteen month reconstituted mice compared to age-matched WT mice. Abbreviations: wks = weeks, mo = months.

