
Figure 1.
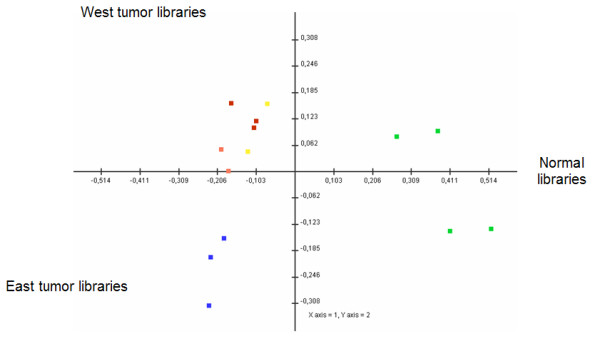
Correspondence Analysis of normal and tumor SAGE libraries of the stomach. A two-dimensional plot is shown where the green dots represent all the normal libraries, the blue dots are the East tumor libraries, and the red, orange and yellow dots are West tumor libraries, microdissected, xenograft and bulk respectively.