
Figure 2.
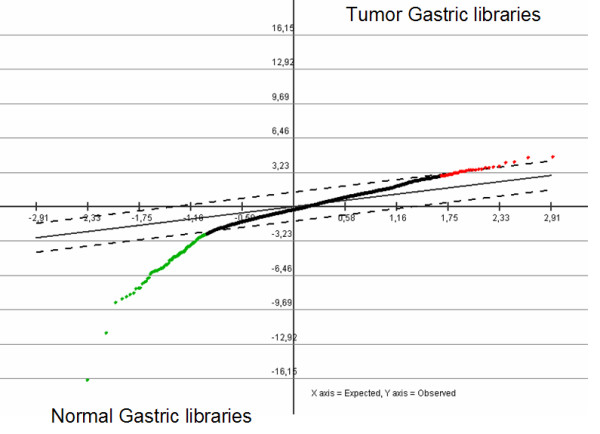
Serial Analysis for Microarray of normal and tumor SAGE libraries of the stomach. To the left and shown in green color, the significant tags with higher expression in the normal libraries; to the right and shown in red color, the significant tags with higher expression in the tumor libraries.