
Figure 4.
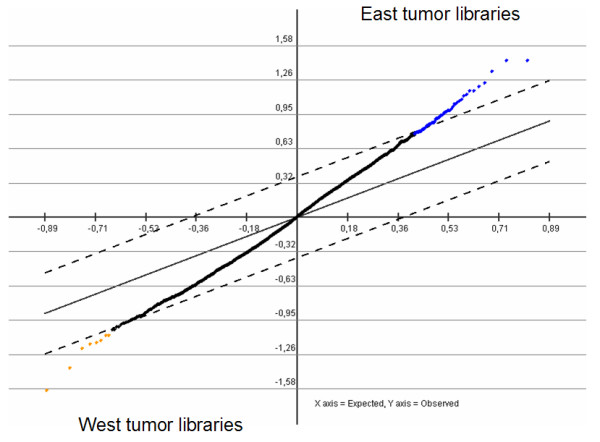
Serial Analysis for Microarray of East and West gastric carcinoma SAGE libraries. To the left and shown in orange color, the significant tags with higher expression in the West tumor libraries; to the right and shown in blue color, the significant tags with higher expression in the East tumor libraries.