
Figure 6.
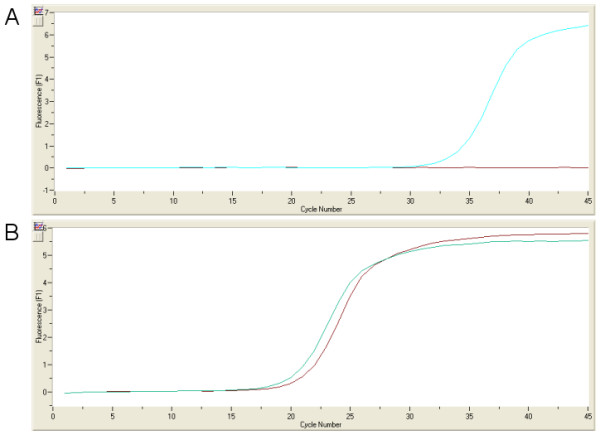
Amplification of PDGFRA (A) and RPL13 (B) mRNA by qRT-PCR. In (A) blue line is the East cell line (MKN45) and red line is the West cell line (N87). In (B) blue line is the East cell line (MKN45) and red line is the West cell line (AGS). Both genes are over-expressed in the East (MKN45) cell line.