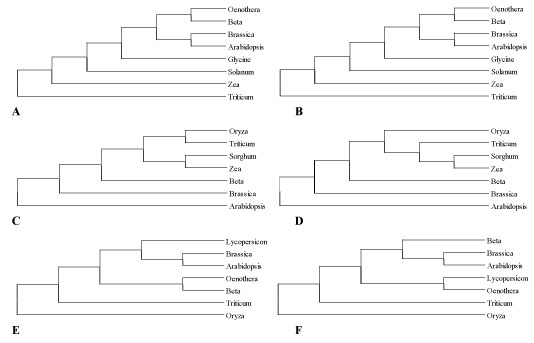
Figure 2.

Examples of genomic and cDNA trees from plant mitochondrial genes. Genomic and cDNA tree topologies for three plant mitochondrial genes with different ratioDt values. A, B) Genomic and cDNA inferred trees for the atp1 gene where ratioDt is equal to 0; C, D) genomic and cDNA topologies deduced for the atp4 gene where there is a moderate editing bias (ratioDt equal to 0.25); E, F) genomic and cDNA trees for the ccb2 gene where there is a strong editing effect (ratioDt equal to 0.50).
