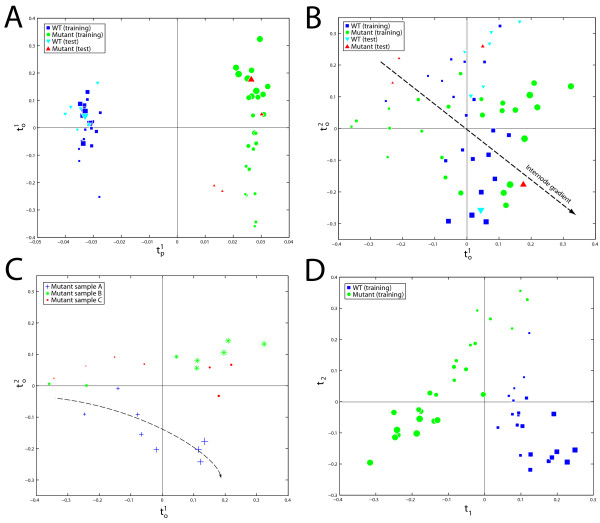
Figure 1.
K-OPLS model properties of the NMR-based metabolic profiling data set. Each point represents a measured observation (biological sample).The size of each glyph in the figure is proportional to the internode number 1–8, denoting a growth gradient. In (A), the K-OPLS predictive score vector t1p is plotted against the first Y-orthogonal score vector t1o. In (B), the first K-OPLS Y-orthogonal score vector t1o is plotted against the second Y-orthogonal score vector t2o. An approximate joint internode gradient, formed by a linear combination of both vectors, is shown using the dashed arrow. In (C), the first K-OPLS Y-orthogonal score vector t1o is plotted against the second Y-orthogonal score vector t2o only for the mutant samples, colour-coded by biological replicate. Biological replicate A displays a deviating behaviour compared to biological replicates B and C; trajectory shown by the dashed line. In (D), the first KPLS latent variable t1 is plotted against the second latent variable t2. The discriminatory direction is now a linear combination of both of the latent variables.

