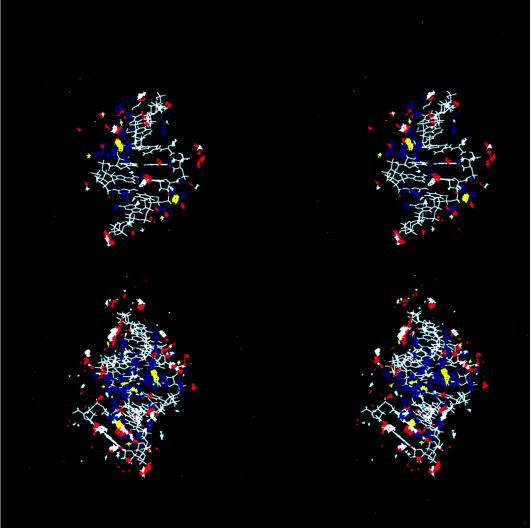
Figure 4.
Hydration and counterion association in grooves of A-DNA. Shown is a stereoview into the minor (Upper) and major (Lower) grooves of the average structure from the final nanosecond of the A-DNA simulation in mixed water/ethanol. Contoured average water oxygen (blue), ethanol oxygen (red), ethanol methyl carbon C5 (white), and Na+ counterion (yellow) density is also displayed. These data are generated (25) by RMS fitting all atoms of the DNA to the first frame, at 1 ps intervals. Then a grid is constructed around the DNA (50 Å3), and for each frame in the trajectory, if the center of the atom of interest is within a particular grid element (each 0.5 Å3), a counter is updated. This grid is then contoured using the midasplus (32) density delegate (written by Christian Schafmeister, University of California, San Francisco). The water and counterion density is contoured at 15.0 hits per grid element (or roughly 3.6 times bulk water density) and the ethanol atoms are contoured at 8.0 hits per grid element (or roughly 4.8 times bulk ethanol density). To simplify the view in Upper and avoid obscuring the view of the hydration into the minor groove, the rear clipping plane is set so that the major groove density in the background is not as apparent; this clips some of the DNA structure in the background and the terminal base pairs (which are visible in the lower figure).

