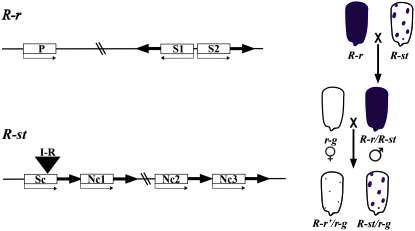
Figure 1.—
Paramutation at r1. The structures of the paramutable (R-r) and paramutagenic (R-st) alleles are diagrammed as well as the crosses and phenotypes used to monitor paramutation. The open boxes represent the r1 genes with the small arrows indicating the direction of transcription: P stands for plant and is a gene expressed in vegetative plant tissues; S1 and S2 are two genes expressed in the seed that are organized in an inverted repeat; Sc stands for self-color and is the most highly expressed gene in the R-st complex; Nc1–Nc3 stand for near colorless, three r1 genes that are expressed at low levels in R-st. I-R indicates the transposable element inserted into Sc, which is responsible for the spotted phenotype. The thick arrows in R-st represent the large repeats spanning the r1 genes. Only the repeats associated with the coding regions are shown. There are additional small, related sequences related to transposable elements that are not diagrammed, but are described in detail with primary references cited in Chandler et al. (2000). A comprehensive list of r1 haplotypes with their tissue-specific expression patterns and paramutation properties can be found in Neuffer et al. (1997).

