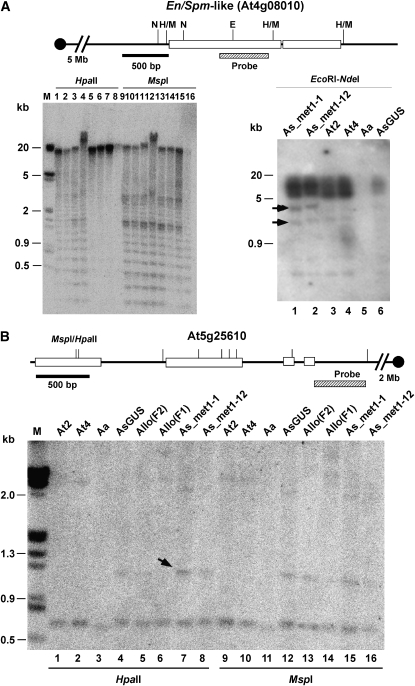
Figure 4.—
DNA methylation changes in the En/Spm-like transposon (At4g08010) and the RD22-like gene (At5g25610) and transposon mobility in met1-1 A. suecica. Left: At4g08010 encoding a transposon En/Spm-like (TES) displayed reduced DNA methylation in met1 A. suecica lines. Multiple bands detected suggest multiple copies of this element. A diagram of DNA fragments is shown at the top. Open boxes and solid lines indicate coding and noncoding regions, respectively. The upstream promoter region is located toward the centromere. The location of DNA probes used in the DNA blot analysis is shown below the diagram. DNA samples are met1-1-I RNAi (lanes 1 and 9), met1-1-II RNAi (lanes 2 and 10), met1-12-I (lanes 3 and 11), met1-12-II (lanes 4 and 12), A. suecica 9502-GUS (AsG, lanes 5 and 13), A. thaliana diploid (At2, lanes 6 and 14), A. thaliana autotetraploid (At4, lanes 7 and 15), and A. arenosa (Aa, lanes 8 and 16). N, NdeI; E, EcoRI; H/M, HpaII/MspI. Molecular size markers are shown in the leftmost lane. Right: mobility of TES in met1-RNAi transgenic lines. Arrows indicate new TES fragments detected. (B) Increased methylation occurs in the 5′ region of a downregulated gene At5g25610 (encoding dehydration-responsive protein, RD22) in met1 lines. The upstream promoter region is located toward the centromere. Allo(F1) and Allo(F2) indicate allotetraploids in the first and second generations, respectively. The labels of all other materials are the same as in A. Arrows indicate an enhanced level of DNA methylation (approximately threefold increase related to the control in lane 4 using the common bands in individual lanes at the bottom of the gel as loading controls).

