Figure 6.—
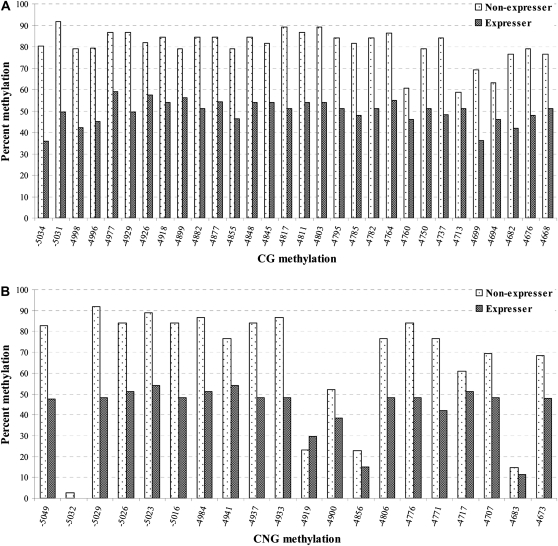
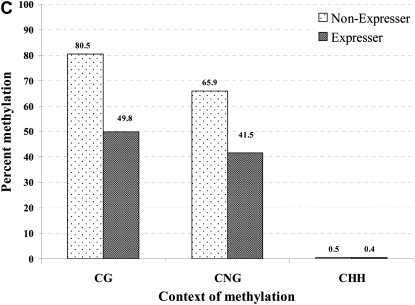
The correlation between DNA hypomethylation and pericarp pigmentation in P1-wr-mum6 was examined by genomic bisulfite sequencing. Leaf genomic DNA of P1-wr-mum6 expresser (i.e., showing red pericarp pigmentation) and nonexpresser plants (i.e., showing colorless pericarp) was used to study cytosine methylation of a distal enhancer (location shown in Figure 5B). We specifically assayed a 387-bp fragment that is located at the 3′ end of the distal enhancer (positions −5052 to −4666 of P1-wr accession EF165349). Methylation of individual CG and CNG sites in this region are shown in A and B, respectively. The position of the sites is shown on the x-axis while the percentage of methylation is presented on the y-axis. The percentage of methylation for each residue was calculated by dividing the methylated clones for that residue by the total number of clones. Two expresser and two nonexpresser plants were studied and the averages are presented here. CGG sites were counted as CG sites. (C) Cumulative methylation in CG, CNG, and CHH (H is A, C, or T) context in the genotypes studied. For each genotype, overall methylation in each context was calculated by dividing the number of methylated cytosines by the total number of cytosines in the context in all the clones. Context of methylation is shown on the x-axis and percentage of methylation is shown on the y-axis.


