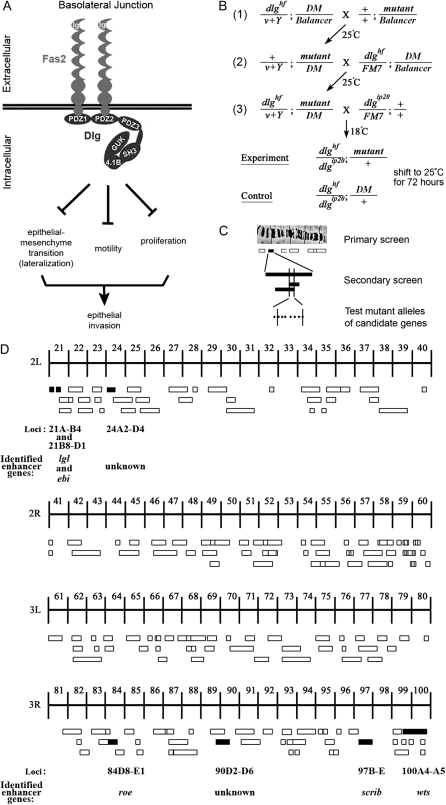
Figure 1.—
Summary of the dlg enhancer screen. (A) Model of the BLJ. Transmembrane Fas2 and scaffolding Dlg repress tumor growth and invasion (Szafranski and Goode 2007). They repress three genetically separable activities, EMT, motility, and proliferation. EMT results in membrane lateralization (see text for discussion). (B) Cross scheme to identify dlg enhancers on the second and third chromosomes. A dominant marker (DM) gene, typically Gla on the second chromosome, or Dr on the third chromosome, was used to follow segregation of mutant chromosomes. The Balancer on the first chromosome was FM7a, on the second chromosome was Cyo, and on the third, TM3, Sb. In the first cross, v+Y is an insertion onto the Y chromosome of a fragment of the X chromosome that covers the dlg locus [10B6-10]. v+Y is introduced into the background of each mutant (cross 2, +/v+Y; mutant/DM) to rescue dlghf lethality in dlghf/v+Y; mutant/DM flies in cross 3. The third cross was completed at 18°, the dlghf/dlgip20 permissive temperature, to bypass dlg lethality. Experimental and control animals were recovered at 18°, then shifted to 25° for 72 ± 2 hr. The same scheme was used to construct dlghf/dlgsw; mutant/+ and dlghf/dlglv55; mutant/+ animals (see text). (C) The screen was completed in three phases. In the primary screen, we used a panel of deletions that uncover most autosomal regions (Bloomington deficiency kit, http://flybase.bio.indiana.edu/). In the secondary screen, we further tested each region that enhanced dlg invasion with additional deletions, to confirm or rule out the enhancing interaction and to refine the position of the interacting locus. Finally, we tested mutations located within the delineated locus to identify the enhancing gene. (D) Schematic summary of the primary screen. The figure shows 178 deficiencies assayed in the primary screen. The deficiencies uncover the genetic regions indicated by the width of the boxes. Deficiencies that scored 100% invasion are solid boxes. Deficiencies that did not enhance invasion are open boxes. The cytological limits of each enhancer locus are shown (the breakpoints are defined by the minimal region that must include the enhancing gene as determined by the pattern of overlap between all enhancing deficiencies). The gene identified as the dlg enhancer at each locus is shown.

