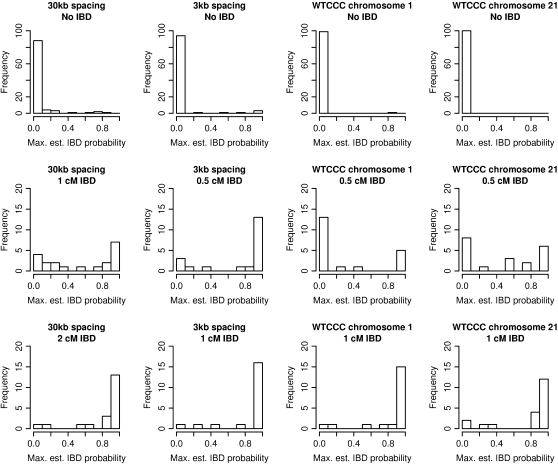
Figure 3.—
Estimated IBD probabilities. Histograms of maximum estimated IBD probabilities from each region. (Top) Results from pairs of haplotypes with no IBD. (Middle) Results from pairs of haplotypes with short tracts of IBD. (Bottom) Results from pairs of haplotypes with long tracts of IBD. The genetic lengths given are approximate.

