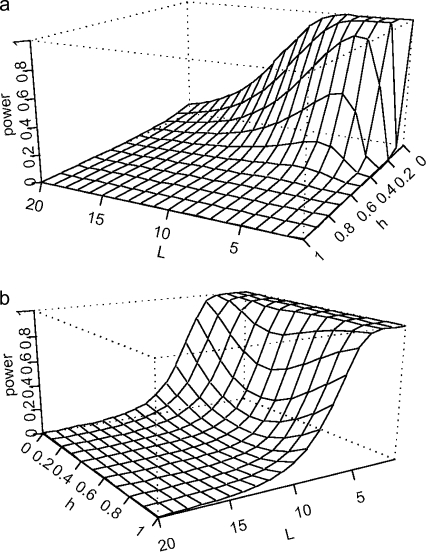
Figure 1.—
Plot of power vs. L (number of disease loci) and h (the dominance coefficient). The power is the probability of rejecting the null hypothesis of no difference in expression between the treatments. Parameter values are π = 0, δ = 1, K = 0.01, and  , and the sample size is 100 for each treatment. In both plots
  and
and  , where
  is the mean expression level for genotype with i disease alleles at the TCL. The dominance coefficient for expression hE is 0 in a and 0.5 in b. The number of genes tested on the microarray was assumed to be 20,000.

