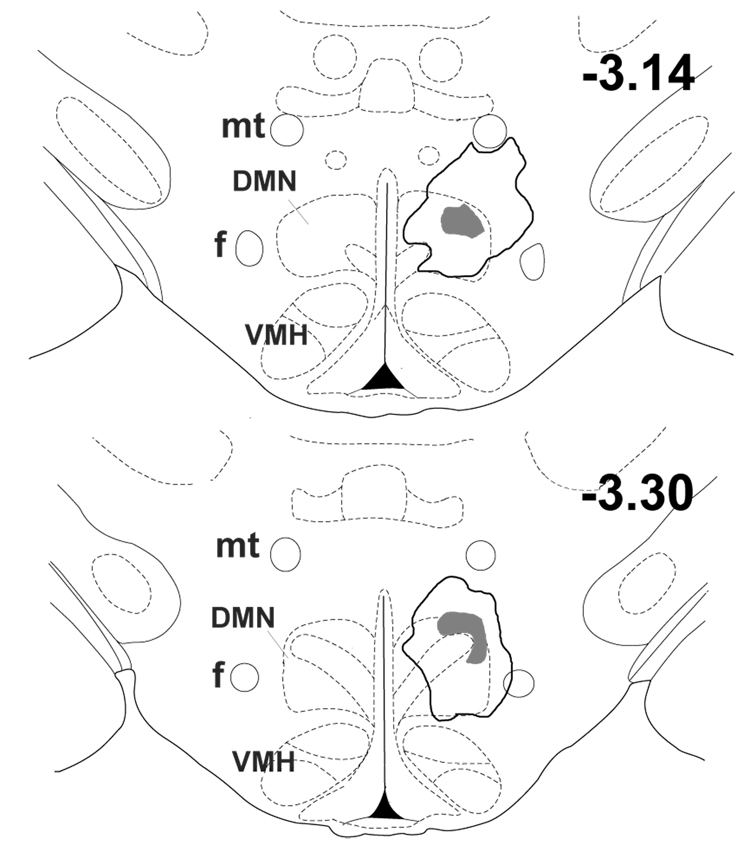
Fig. 6.
Schematic coronal sections adapted from the atlas of Paxinos and Watson (1998) depicting the composite distribution of intense Fos expression extending continuously from the site of injection of BMI in the DMH. Numbers indicate distance from bregma. Intense Fos expression was apparent in all eight experiments at these two atlas levels only and is represented by shaded area. Bold line outlines area where uniformly intense fos expression was apparent in at least two experiments.

