
Fig. 7.
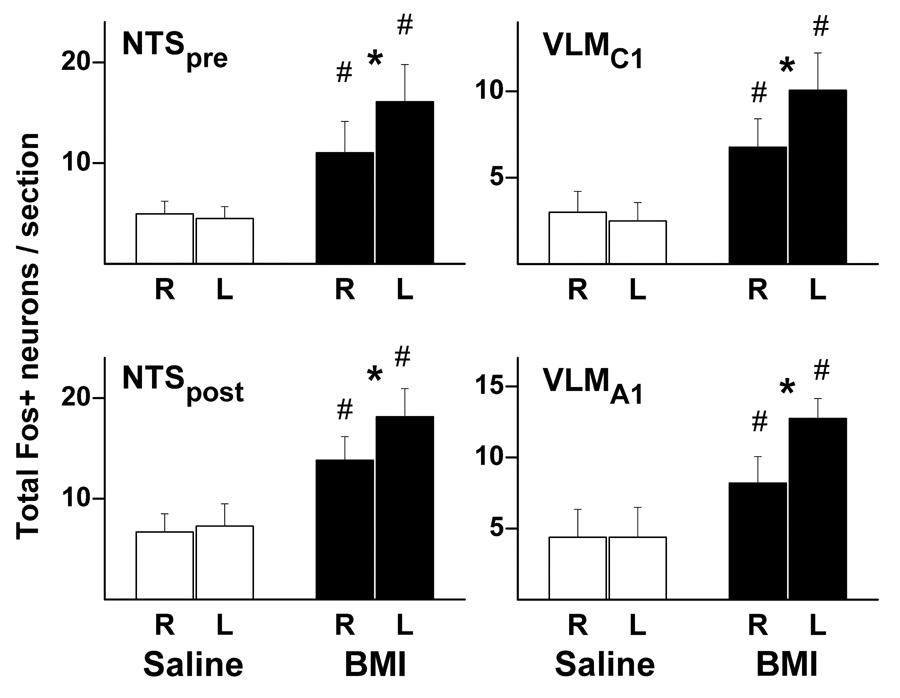
Graphic summary of mean number (± SEM) of Fos-positive neurons per rat in the pre-commissural (NTSpre; saline – n=4; BMI – n=6) and post-commissural (NTSpost; saline – n=4; BMI – n=7) subregions of the brainstem NTS (left) and in the VLM at levels corresponding to C1 (RVLMC1; saline – n=4; BMI – n= 6) and A1 (VLMA1; saline – n=4; BMI – n= 7) according to the atlas of Paxinos and Watson (1998). Rats subjected to unilateral microinjection of either saline 100 nL (open bars) or BMI 10 pmol (filled bars) into the left DMH. (R – right side; L – left side) # - greater than corresponding value in saline-injected control rats; * - greater than uninjected side, p<0.05.