
Fig. 8.
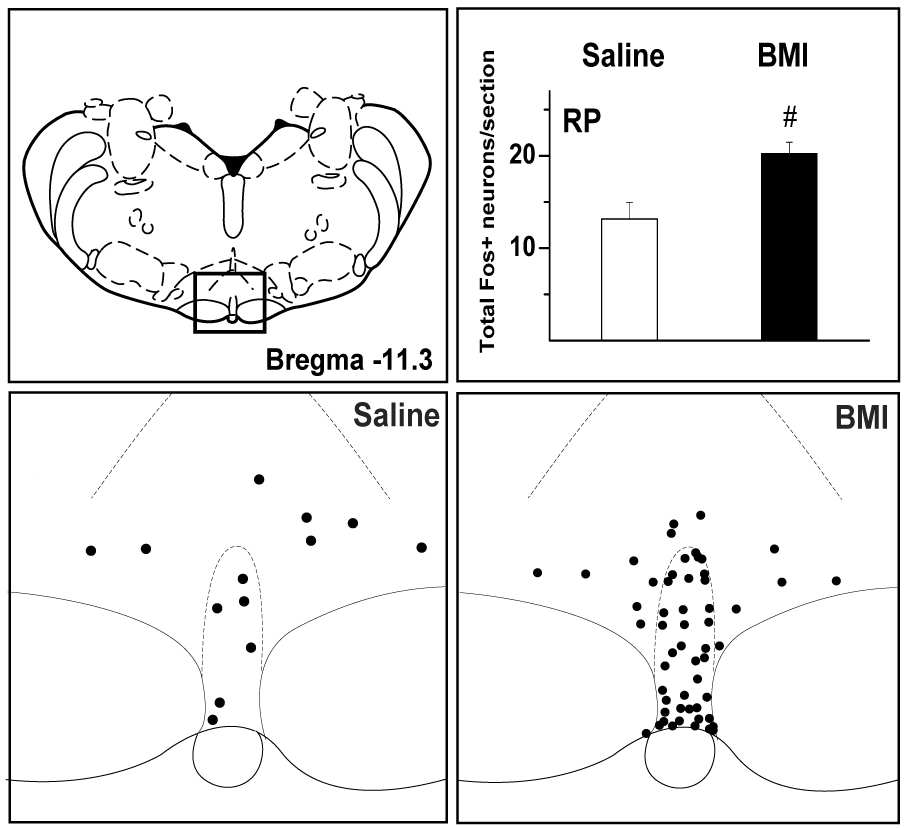
Fos expression in the rRP in saline- and BMI- treated rats. Schematic adapted from the atlas of Paxinos and Watson (1998) for orientation (TOP LEFT) and line drawings representing boxed area in schematic (BOTTOM) depicting Fos expression in the rRP in a representative saline-injected control rat (BOTTOM LEFT) and a rat after microinjection of BMI 10 pmol into the left DMH (BOTTOM RIGHT). Each dot represents one Fos-positive neuron. TOP RIGHT - Graphic summary of mean number (± SEM) of fos-positive neurons in the rRP. SALINE (left – open bar) – unilateral microinjection of saline 100 nL into the left DMH (n=4); BMI (right – filled bar) – unilateral microinjection of BMI 10 pmol into the left DMH (n=8). # - greater than corresponding value in saline-injected control rats, p<0.05.