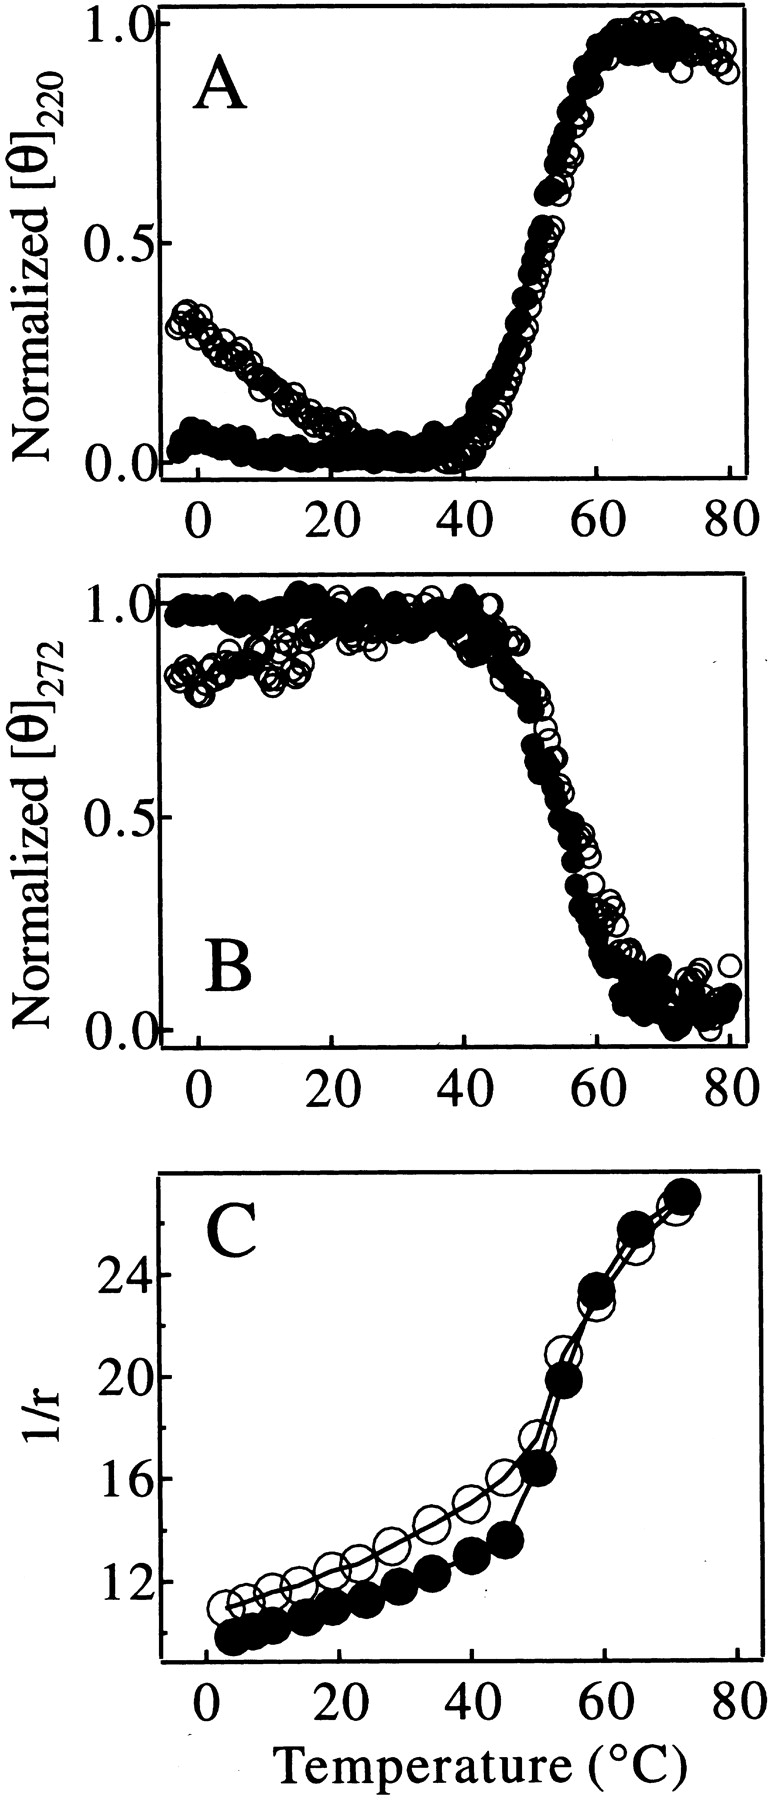
Figure 6.

Thermal denaturation curves of the C fragment (filled circles) and the IP state (open circles) of pepsin monitored by [θ]220nm (A), [θ]272nm (B), and 1/r of tryptophan fluorescence (C). The ellipticity in A and B was normalized to the maximum ellipticity change in the temperature range shown in the figures.
