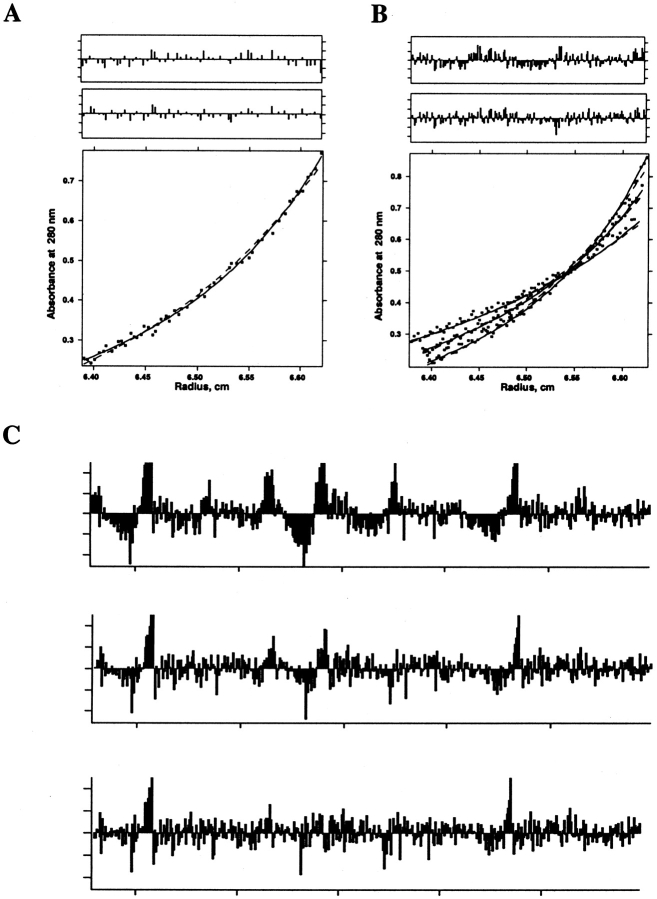
Figure 3.
Analytical ultracentrifugation data of a peptide from the transmembrane region of influenza A virus M2 proton channel in DPC micelles. A subset of these data was published in Kochendoerfer et al. (1999). Detergent-solubilized peptide at a peptide/detergent ratio of 1/284 (53 μM peptide, 15 mM DPC) in 50 mM Tris-HCl (pH 7.5), 100 mM NaCl, and 0.5 mM TCEP was centrifuged to equilibrium at 42 krpm, and optical density at 280 nm versus radius data (bottom panel) was fit to functions describing sedimentation equilibrium of a dimer (dashed line) and a monomer in equilibrium with a tetramer (solid line). (A, top two panels) Fit residuals for dimer and monomer–tetramer models. (B) As in A, except data were obtained at two additional speeds (36 and 48 krpm). Fits were done using a single dissociation constant and baseline per model for all data sets. Residuals of all three data sets were concatenated for each of the upper two panels. (C) Concatenated residuals for, respectively, dimer, monomer–trimer, and monomer–tetramer model fits to data obtained as in A and B, but with samples prepared at two additional peptide/detergent ratios (1/126 and 1/554). Fits were done using a single dissociation constant per model for all data sets and a single baseline for each peptide/detergent ratio.

