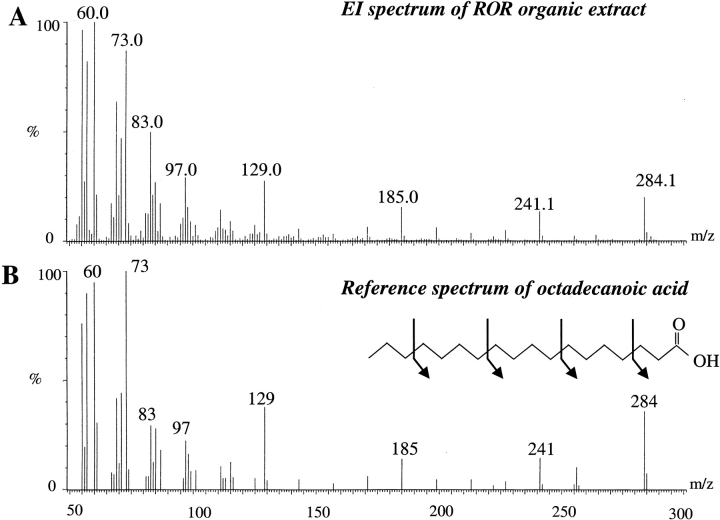
Figure 3.
Identification of the ligand of RORβ by GC-MS after organic extraction. Electron ionization (EI) spectra of the organic fraction of the RORβ preparation (A) and EI reference spectrum of the octadecanoic acid (B). The arrows show the fragmentation along the hydrocarbon backbone as occurring in the mass spectrometer source.

