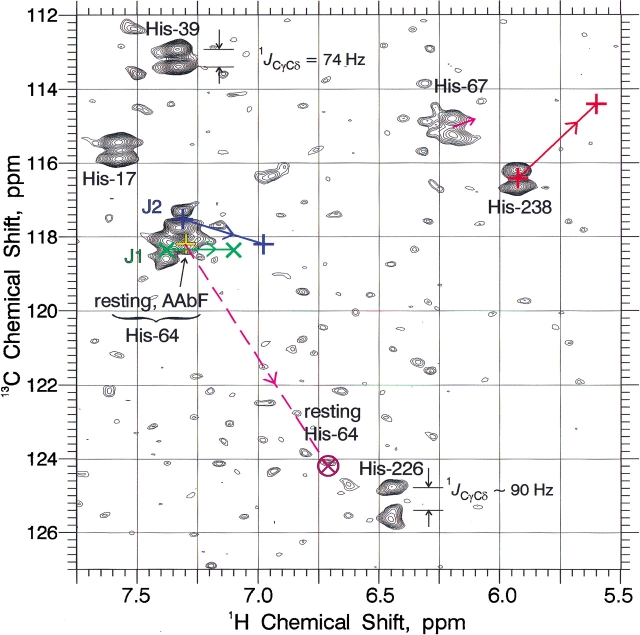
Figure 6.
Two-dimensional 1H/13Cδ2 HMQC NMR spectrum (600 MHz) for one-bond correlation in uniformly 13C, 15N histidine-labeled subtilisin N155A, and various complexes at 25°C. Solid colored lines show trajectories of certain peaks vs. pH, with arrows pointing in the direction of pH increase. Broken colored lines indicate jumps from one, more or less, to the other. Underlying spectra were obtained at pH 5.50. J1 and J2 are the principal autolysis products.

