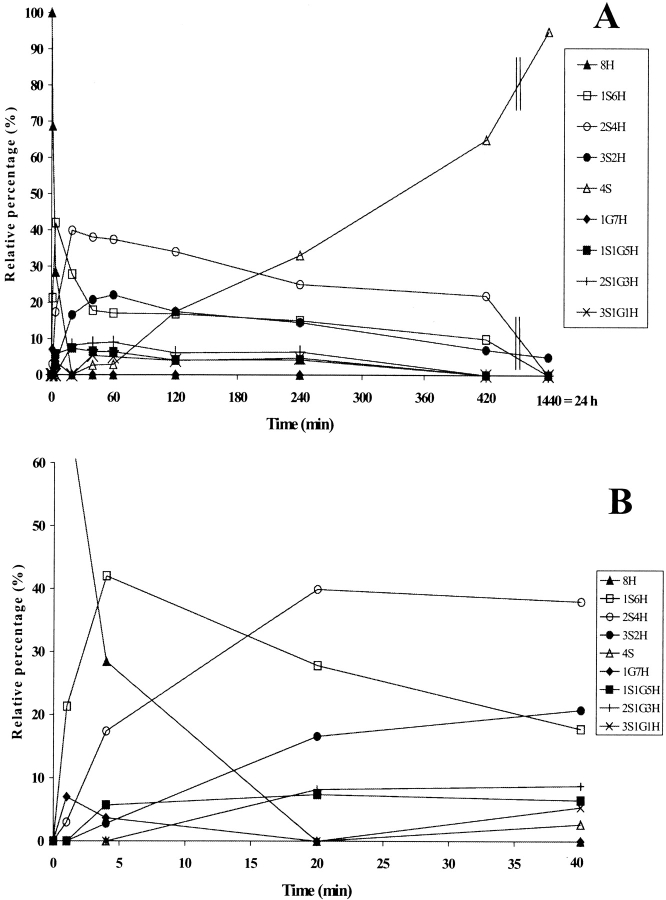
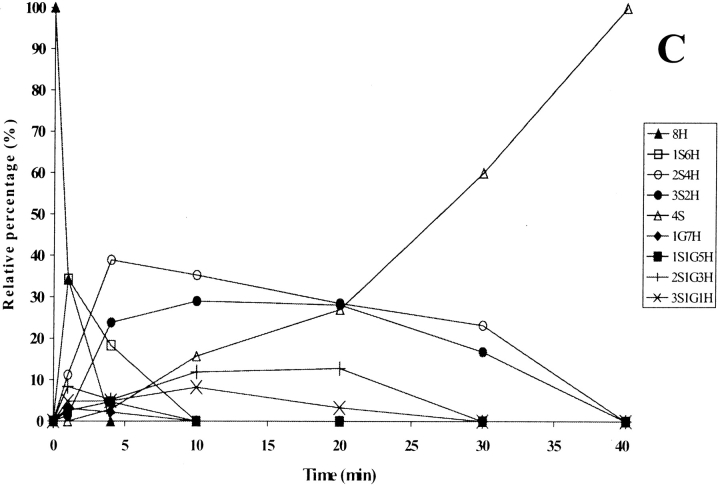
Figure 3.
(A) Time-course analysis of the folding of RNase A in the presence of 1.5 mM GSH/0.3 mM GSSG (taken from Ruoppolo et al. 1997). (B) Early stages of the time-course shown in A. (C) Time-course analysis of folding in the presence of wild-type protein disulfide isomerase (PDI). PDI was incubated with 1.5 mM GSH/0.3 mM GSSG for 10 min at 25°C and then added to RNase A (1 mg/mL = 73 μM) at a concentration of 10 μM. Percentages of intermediates were derived by electrospray ionization mass spectrometry analysis. The differences between folding experiments performed completely independent of each other were about 5%. For the sake of clarity, error bars are not shown. nS represents intramolecular disulfide bonds, nG mixed disulfides with glutathione, and nH free thiols.


