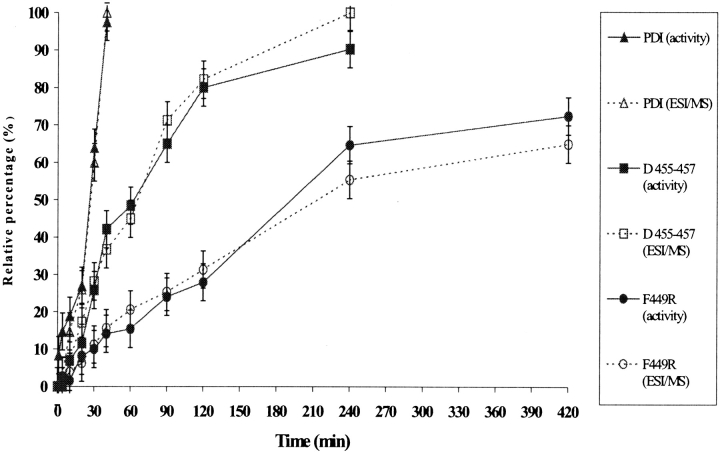
Figure 7.
Appearance of the 4S species in the RNase A folding, as detected by electrospray ionization mass spectrometry (ESIMS) analysis under different conditions, relative to the recovery of enzyme activity from aliquots of the same folding reactions. The continuous and dotted lines refer to the activity data and ESIMS data, respectively.

