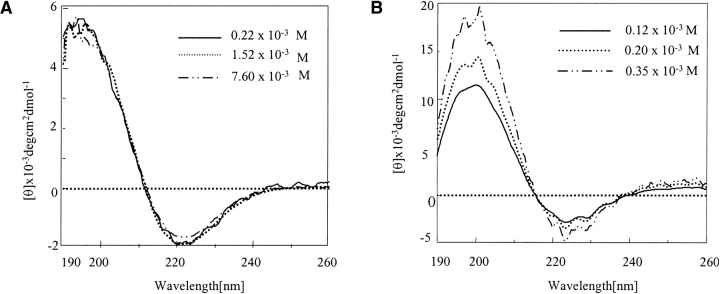
Figure 1.
CD spectra of HPLC-purified Q12HQHQ12HQHQ12 and Q42 in sodium chloride/sodium citrate buffer at various concentrations. (A) Q12HQHQ12HQHQ12 exhibits a concentration-independent CD pattern indicating intramolecular nature of the β structure. (B) Q42 shows a concentration-dependent CD pattern, indicating stabilization of the β structure through intermolecular hydrogen bonding.

