
Figure 4.
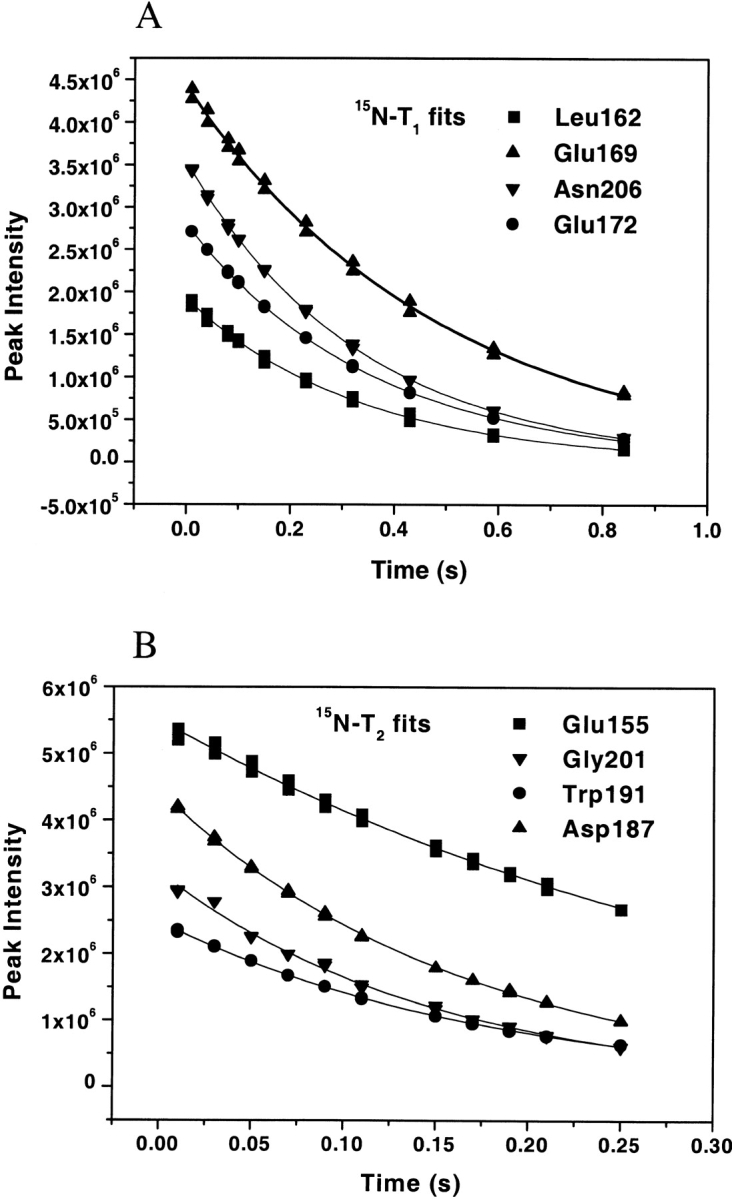
Representatives of the worst (L162, E169, E155, G201) and the best (N206, E172, W191, D187) fits of 15N−T1 (A) and T2 (B). Fitting errors are <2% and <1% for the worst and best fits, respectively. Duplicate points are taken for each time delay and shown in the same graph.