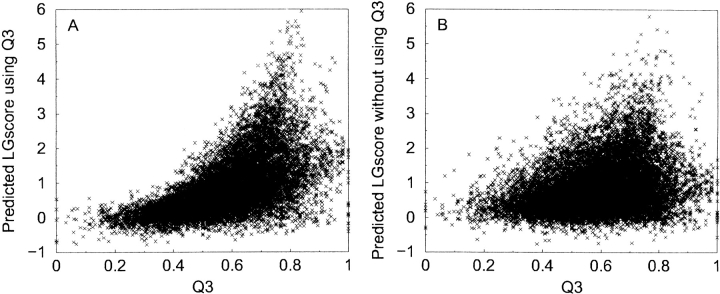
Figure 1.
Fraction of similarity between predicted secondary structure and the secondary structure in the model (Q3) plotted against predicted LGscore, for networks trained with Q3 (A) and without Q3 (B). The networks trained with Q3 tend to give low scores to models with low Q3 and higher scores in the region Q3 ∈ {0.7, 0.8}

