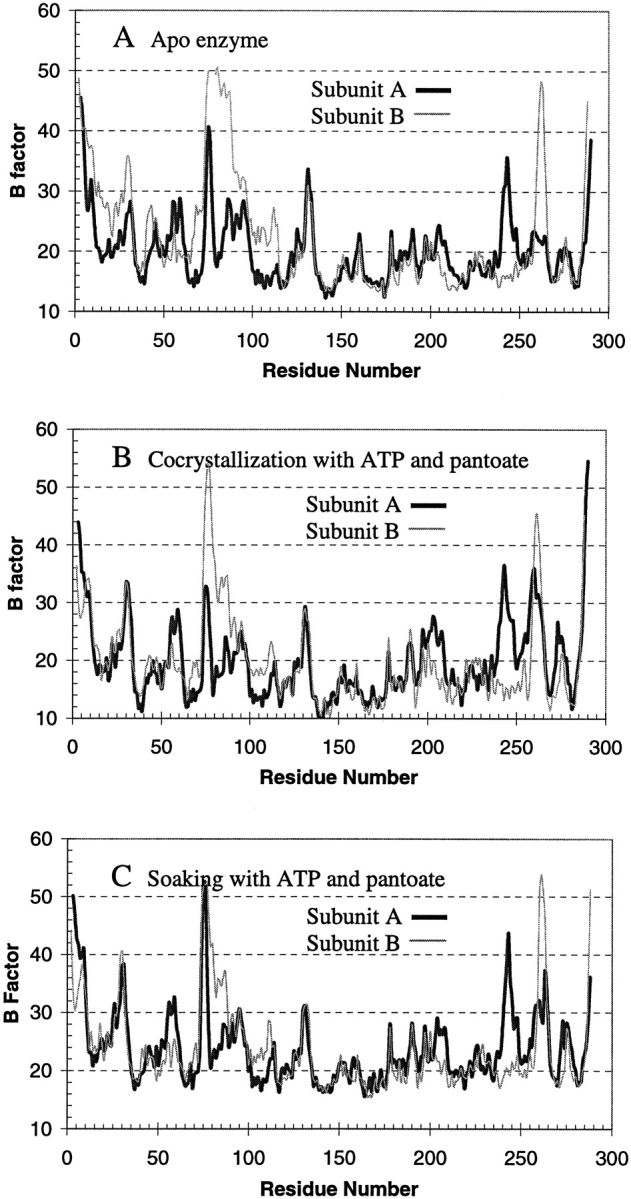
Figure 3.

Average B factors of main chain atoms plotted against residue number. The dark thick curves are those of subunit A, and the light thin curves are those of subunit B. Subunit B of the apo enzyme (A, thin curve) has high B factors for residues from 75 to 88, with residues 76–78 totally disordered. However, these residues are ordered and have lower B factors in the crystal structure of the reaction intermediate complex from cocrystallization (B). Soaking of the apo enzyme crystals in solutions containing ATP and pantoate (C) also resulted in the disordered residues becoming ordered, and gave a profile of the B factors more similar to that of cocrystallized intermediate complex (B) than to that of the apo enzyme (A).
