Figure 2.
(Continued on next page)
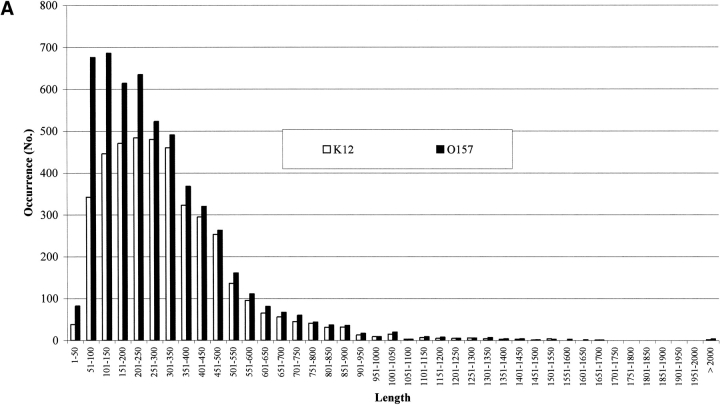
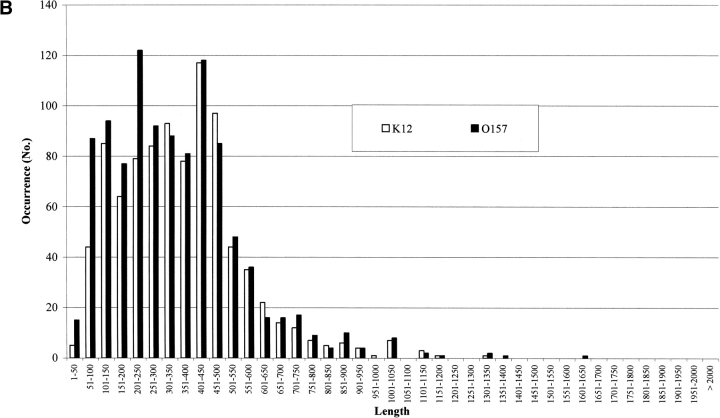
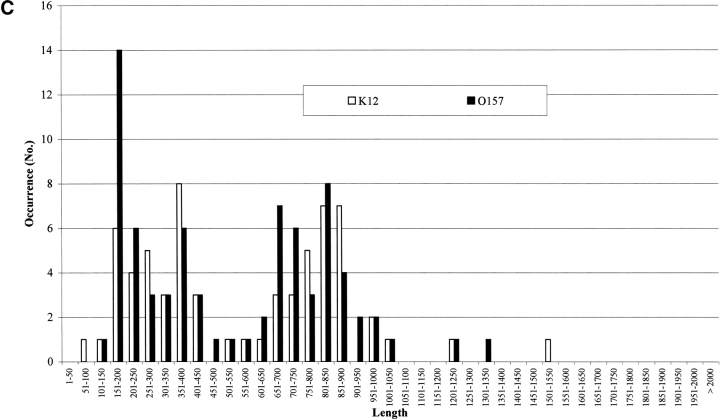
The length distribution of protein chains in E. coli K12 and O157. (A) Bar plot of the length distribution of proteins in the genomes. (B) Bar plot of the length distribution of inner membrane proteins after prediction with Hunter in both strains. (C) Bar plot of the length distribution of outer membrane proteins after prediction with Hunter in both strains.


