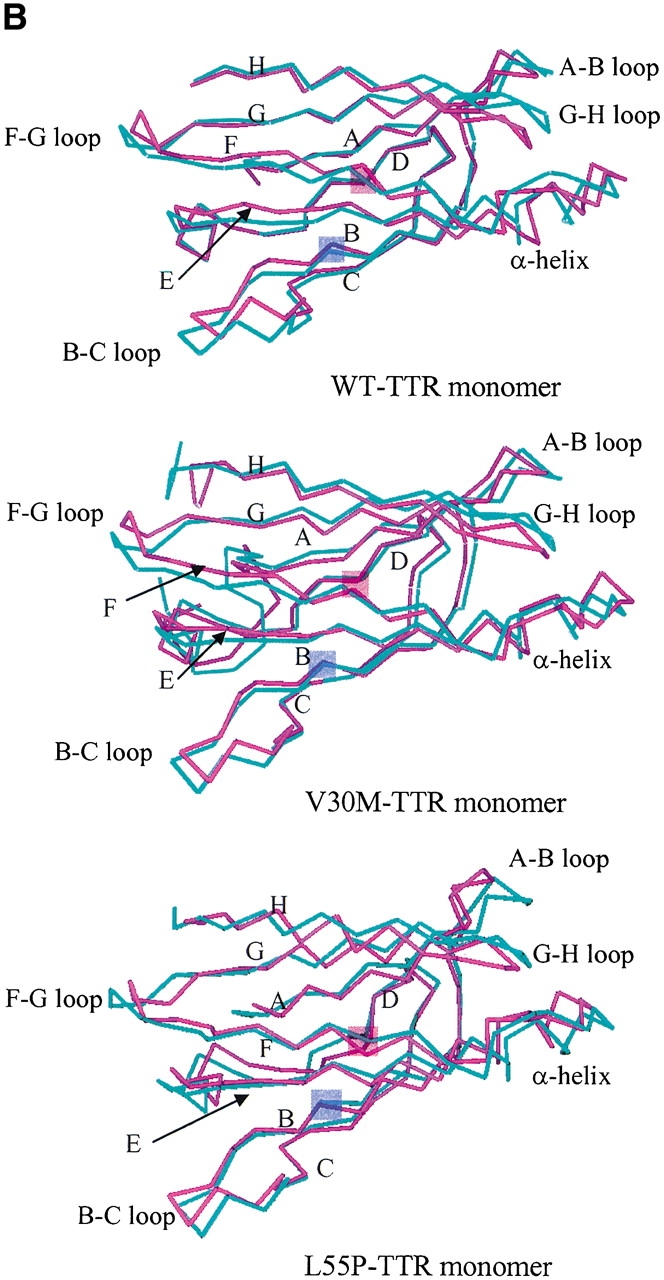
Figure 2.

(A) The root-mean-square (RMS) deviation of the main chain atoms in the β-sheet region relative to the corresponding initial structure as a function of simulation time. Block averaging was used with 15 psec per block. (B) Superposition of the α-carbons of the initial structure of the simulation (cyan) and the average structure along the trajectory (magenta). Residue number 30 and 55 are shaded in violet and in pink, respectively.

