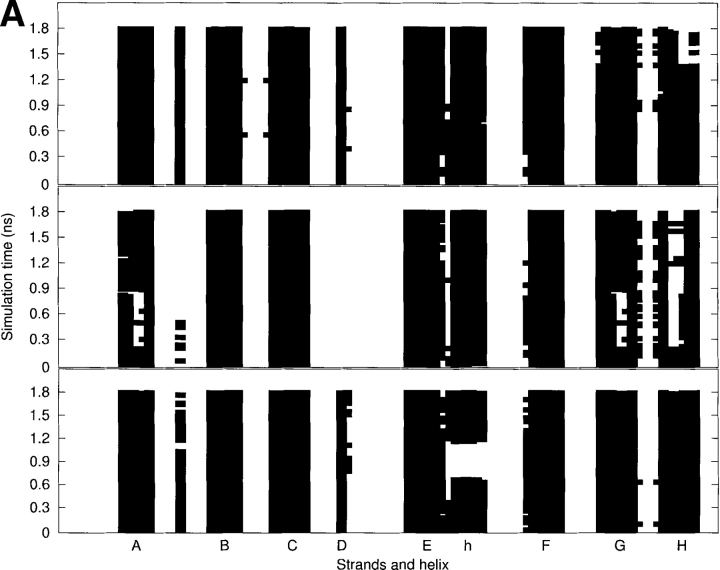
Figure 4.
(A) The secondary structure analyses along the MD trajectories using DSSP (Kabsch and Sander 1983) for the WT (top), L55P (middle), and V30M (bottom) TTR monomers. More attention should be paid to the results after 600 psec (0.6 nsec). The β-strands are named from A to H. “h” denotes the α-helix. A solid square represents that a residue adopts the β-sheet or α-helix conformation. (B) The schematic representations of hydrogen bonds between backbone amide groups in the β-sandwich region. The solid arrow denotes the hydrogen bond that is persistent in the three monomers; the dashed-line arrow and the dotted-line arrow denote the hydrogen bond with low occupancy (<70%) in the L55P-TTR monomer and WT-TTR monomer, respectively; the dotted/dashed-line arrow represents the hydrogen bond with low occupancy (<70%) in both L55P and WT monomers. Arrow points from hydrogen bond donor to acceptor.


