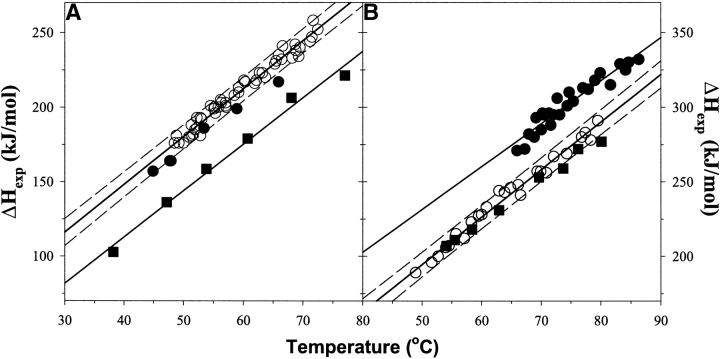
Figure 2.
Temperature dependence of the enthalpy of unfolding for the studied ubiquitin variants. (A) (Squares) WT, (open circles) all but G32 substitutions in WTAAA background, and (filled circles) G32 substitution in WTAAA background. (B) (Squares) WT#, (filled circles) position 28 substitutions in the WT#4A background, and (open circles) position 28 substitutions in the WT#4AV5A background. Solid lines represent the linear fit with the slope that represents the heat capacity change upon unfolding, ΔCp = 3.2 ± 0.3 kJ/(K•mole); dashed lines show errors at the 95% confidence.

