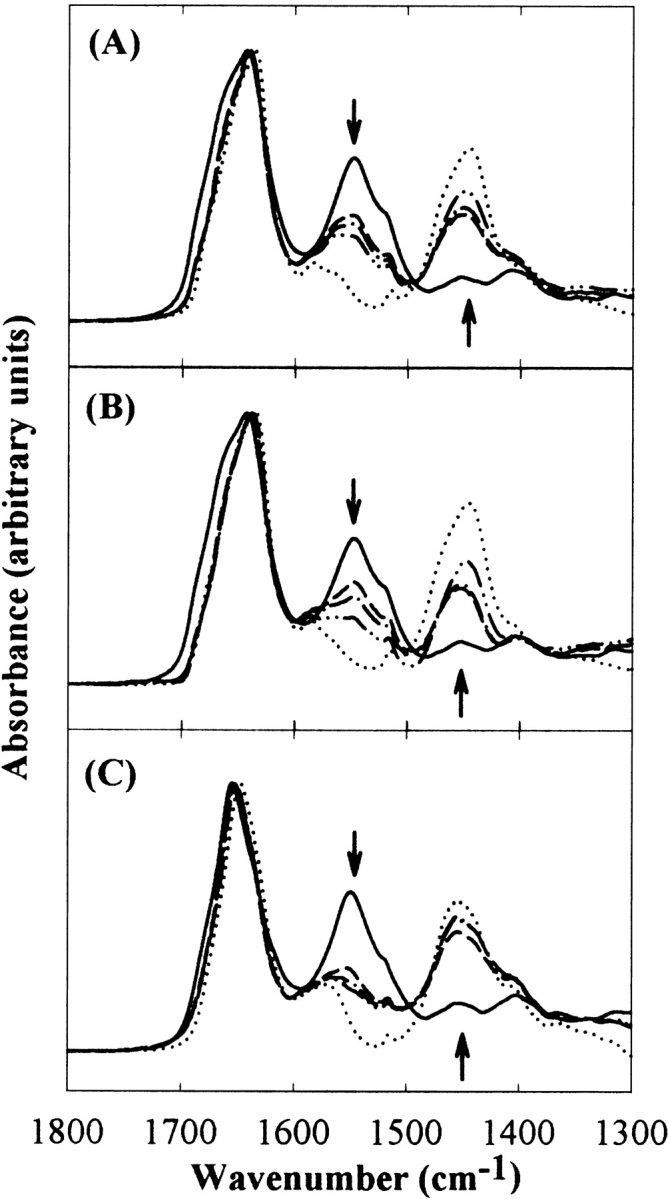
Figure 4.

Representative IR amide absorbance spectra of HX for RNase A (A), RNase S (B), and Cyt c (C), showing the amide I, II, and II′ peaks. The solid and dotted lines represent the spectra of nondeuterated proteins in H2O buffer and the completely deuterated proteins in 100% D2O buffer, respectively. Other lines are representative spectra of proteins exposed to 75% D2O buffer. Arrows indicate the direction of spectral changes with the progress of HX.
