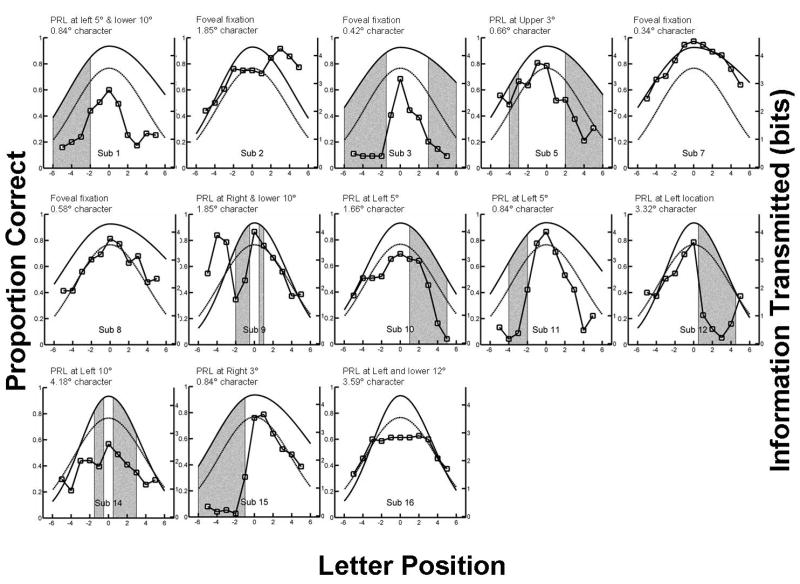
Figure 3.
Each panel shows the visual-span profile for an AMD subject (data points are connected by line segments). The dark solid curves show average visual-span profiles for normal central vision at a print size close to the value used for the individual AMD subject. The dashed curves show average visual-span profiles in normal peripheral vision (10° in the lower visual field with print size of 3.5°). The gray bars show the estimated locations of scotomas. Sub 2, 7 and 8 showed no scotoma whereas Sub 16 adopted an inferior-left PRL by shifting the scotoma to her upper visual field, resulting in no scotoma lying along the horizontal meridian where the visual span was measured. Eccentricity of the point of fixation (foveal or PRL) and character size used to measure visual span is shown for each individual subject.

