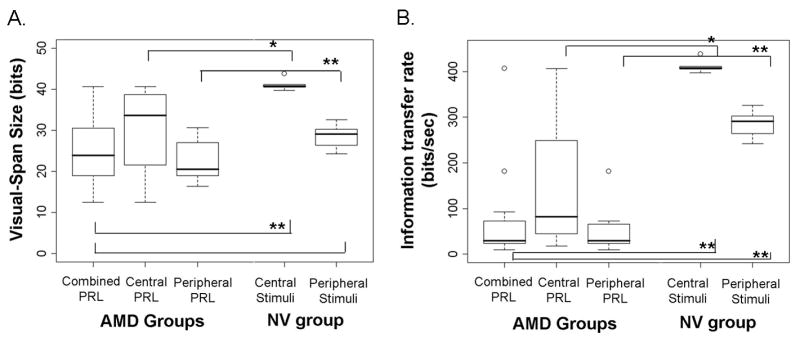
Figure 4.

Box plots for visual-span size (panel A) and information transfer rate (panel B). Data are shown for AMD subjects with different fixations: 1) central preferred retinal locus (PRL) (N = 4); 2) peripheral PRL (N = 9); and 3) the combined group (N = 13), and for age-matched normal controls (NV) tested with central stimuli (N = 5) and with peripheral stimuli at 10° in the lower visual field (N = 11).
