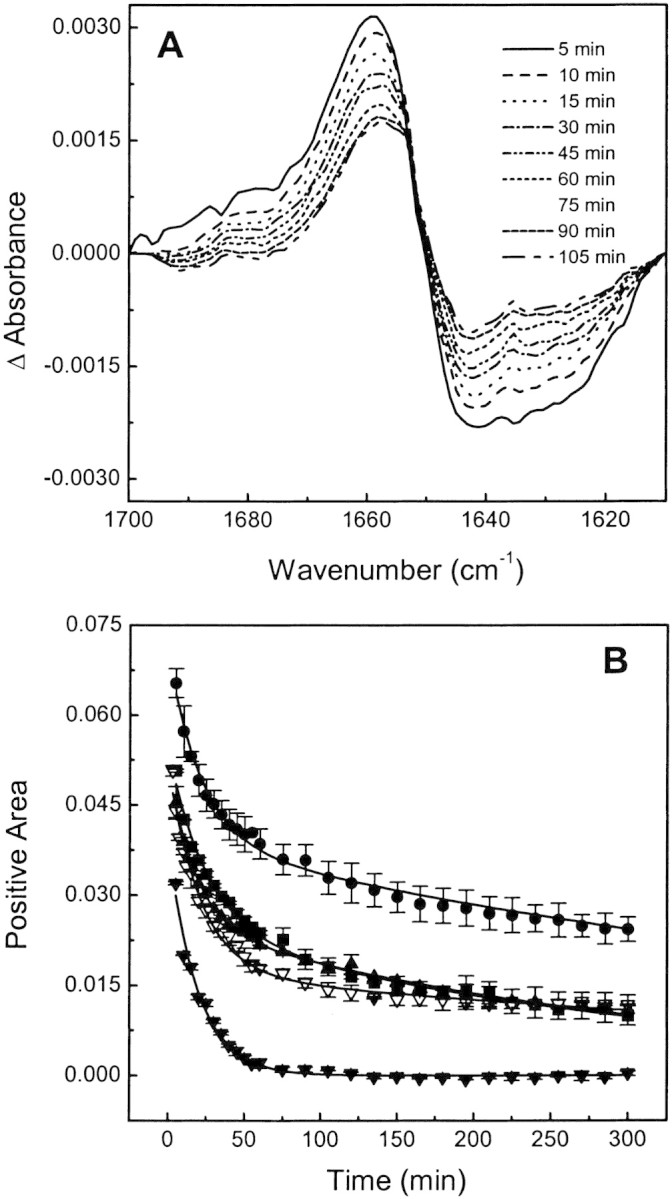
Figure 4.

H/D exchange of BSA at different binding conditions. (A) Representative FTIR difference spectra showing the time-dependent changes in the amide I‘ region after sample dispersion in D2O buffer. (B) Kinetics of H/D exchange of free BSA (squares) and its complexes with 1,8-ANS (circles) and 2,6-ANS (solid triangles) at a 50:1 ligand:protein mole ratio and with bis-ANS at 5:1 (open triangles) and 50:1 (solid down triangles) ligand:protein mole ratio.
