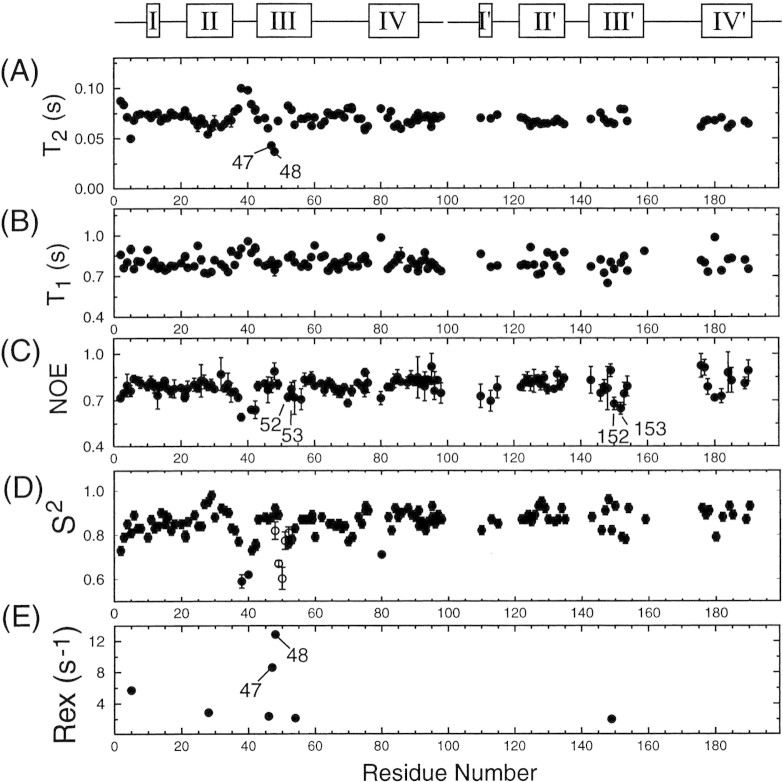
Figure 6.
Comparison of backbone amide 15N (A) T2, (B) T1, and (C) NOE values and model-free parameters (D) S2 and (E) Rex values with residue number of PRD25N bound to substrate C. The open rectangles at the top of the figure indicate regions that exhibit different 1H/15N/13Cα backbone chemical shifts in each subunit. For these regions, the data are shown in two sets; for one, residues are numbered from 1 to 99, and for the other, residues are numbered from 101 to 199. Residues whose amide correlations were resolved, but whose 13Cα chemical shifts were indistinguishable in the two subunits yielded two relaxation data sets, both of which are plotted versus residues numbered 1–99. However, almost identical T2, T1, and NOE values were measured in each monomer for this set of residues, and therefore their relaxation rates are not distinguishable in the figure. Parameters for residues having degenerate amide chemical shifts in the two monomers are plotted versus residue numbers 1–99. For comparison, S2 values of the flap region for the free PRD25N, measured using the same experimental conditions, are shown in (D), by open circles.

