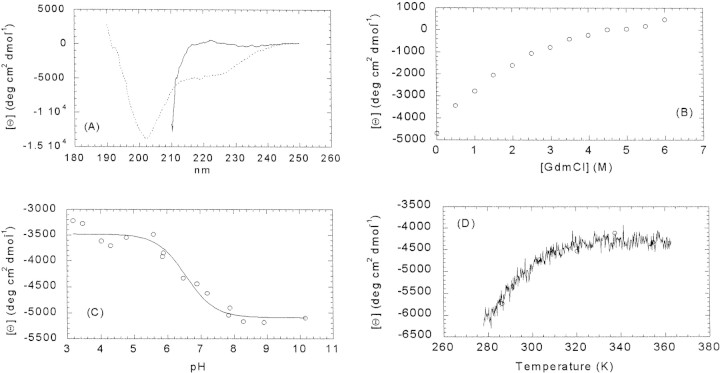
Figure 1.
Far-UV CD of IF7. (A) Spectrum of IF7 at pH 6.5 (dotted line) and at 6 M GdmCl, pH 6.5 (continuous line) at 298 K. (B) Change in the ellipticity at 222 nm upon GdmCl concentration changes at 298 K. (C) Changes in the spectra at 222 nm upon pH changes at 298 K. The continuous line is the fitting to Equation 6; see text for details. (D) Thermal denaturation profiles at pH 6.5 followed by the changes in the ellipticity at 222 nm. The conditions were 20–30 μM of protein; buffer concentration was 10 mM in all cases. Spectra were acquired in 0.1-cm-pathlength cells.

