
Figure 3.
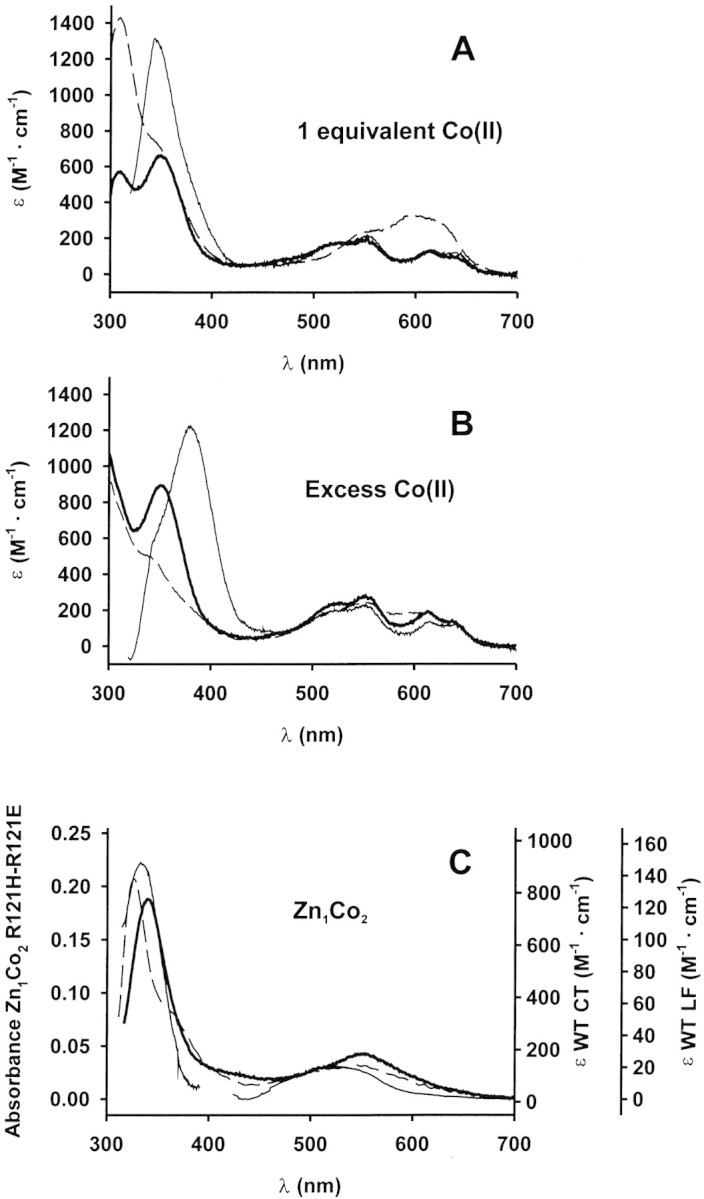
Electronic spectra of metal derivatives. (A, B) UV-visible spectra of the Co(II) adducts in Hepes 15 mM pH 7.0. Enzyme concentrations were 120 μM (wild type, thin line), 91 μM (R121H, dashed line), and 77 μM (R121E, bold line). (A) 1 equivalent of Co(II) added. (B) Excess Co(II) added: 500 μM Co(II) for wild type and R121H BcII and 1 mM Co(II) for R121E BcII. (C) UV-visible spectra of Zn1Co2 derivatives. Left vertical axis (absorbance) corresponds to the mutant enzymes spectra, and right axes (molar absorptivities) correspond to the wild-type enzyme spectrum. The 300–400 nm region of the wild-type BcII Zn1Co2 derivative spectrum (thin line) corresponds to 0.15 mM enzyme reconstituted with 20 mM Co(II). The visible region of the same spectrum was recorded with 8 mM enzyme with 9 mM added Co(II). Spectra of the mutant enzymes were recorded in samples containing 1.7 mM enzyme and 10 mM Co(II) (R121H dashed line), and 3.5 mM enzyme and 10 mM Co(II) (R121E bold line).