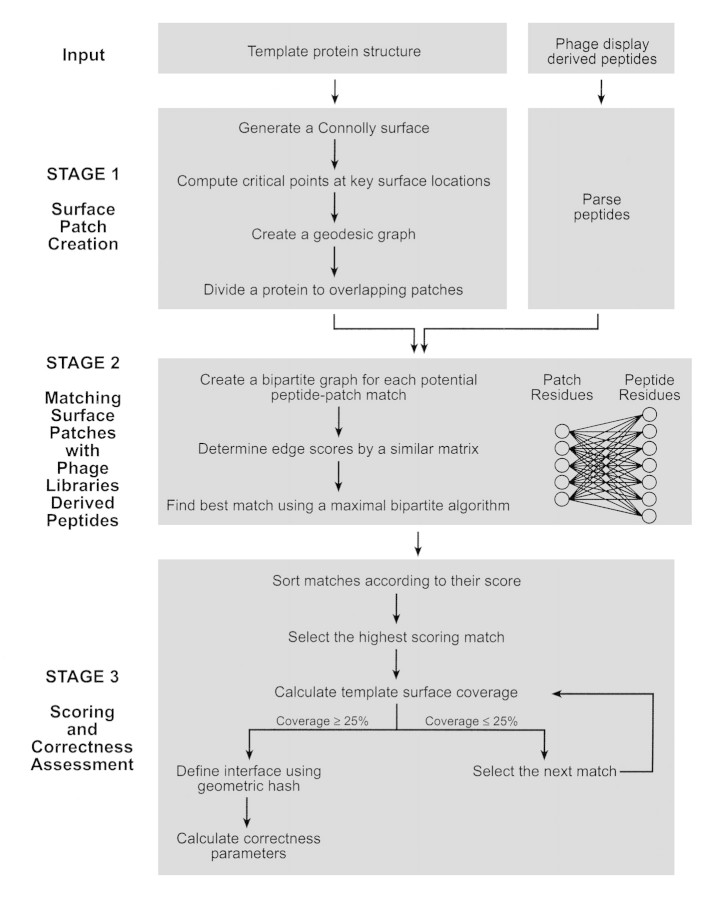
Figure 2.
SiteLight algorithm flow chart. This chart gives a schematic description of the SiteLight algorithm. The algorithm is described in further detail in Materials and Methods. SiteLight seeks to match a phage display-derived peptide to a 3D epitope on a protein surface. The surface of the protein is divided into overlapping patches. The division is based on geodesic distances between two residues rather than on Euclidean distances. SiteLight examines the potential match of each peptide in the library with each patch. For each potential match a bipartite graph, Graph 2, is created. Its vertices represent patch and peptide residues. Its edges represent similarity between two residues. Residue similarity is determined by a similarity matrix (Table 2▶ in Supplemental Material). The best alignment of a peptide and a patch represented in a bipartite graph is found by the maximal bipartite matching algorithm. The score of each match is determined according to the best alignment. Potential matches are sorted by their scores. High scoring matches are iteratively selected until 25% of the Template protein is covered. The minimized surface is expected to include the binding site between the Template and the Target. To assess SiteLight’s success, the "correct" binding site is determined. This site is defined by the Template-Target complex interface (i.e., Template residues that are spatially proximal to the Target). The correctness of each match is represented by the patch overlap with the interface.

