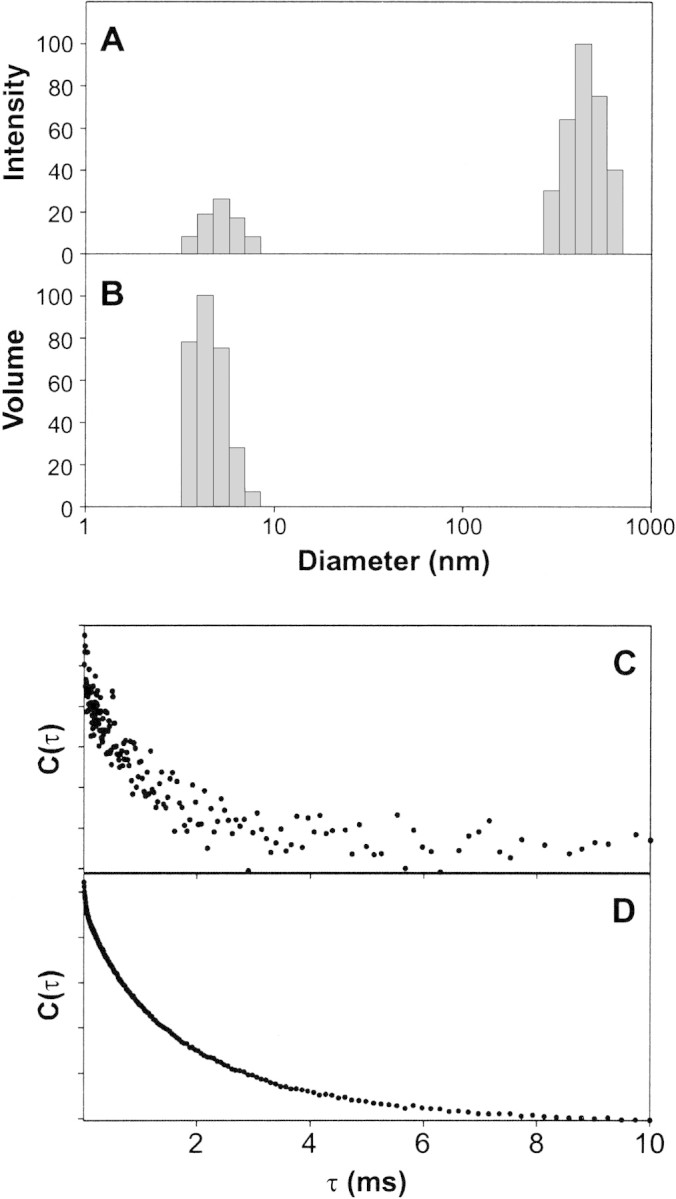
Figure 4.

Dynamic light scattering of MBP at different pH values. Intensity-weighted (A) and volume-weighted (B) size distributions of 0.1 mg/mL bMBP-Cit0 alone in 20 mM HEPES-NaOH (pH 7.4), 200 mM NaCl, and 1 mM CaCl2. (C, D) Correlation functions for bMBP-Cit0 at pH 7.4 in the HEPES buffer (C) and at pH 6.0 in 20 mM MES-NaOH, 200 mM NaCl, and 1 mM CaCl2 (D).
