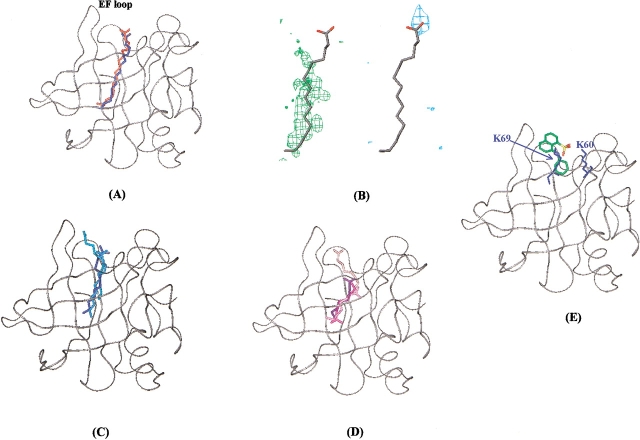
Figure 6.
Docking solutions obtained from GRID program for interaction of BLG with palmitic, lauric, caprylic acids, and ANS. (A) Superposition of predicted (blue) and experimentally observed (red) positions of palmitic acid within BLG. BLG backbone (PDB code 1bsy) is shown in gray in a ribbon representation. (B) Graphical representation of MIF in the region of palmitic acid binding site. Palmitic acid docking solution is shown in gray. The green and blue contours indicate regions of favorable interaction energies for hydrophobic (energy level = −0.5 Kcal/mole) and carboxyl oxygen (energy level = −6.2 Kcal/mole) probes, respectively. (C) Docking solutions obtained for lauric acid. (D) Docking solutions obtained for caprylic acid. Darker colors correspond to lower energy solutions. (E) Docking solution obtained for ANS. ANS molecule is colored by atom type. K60 and K69 side-chains are displayed in blue.

