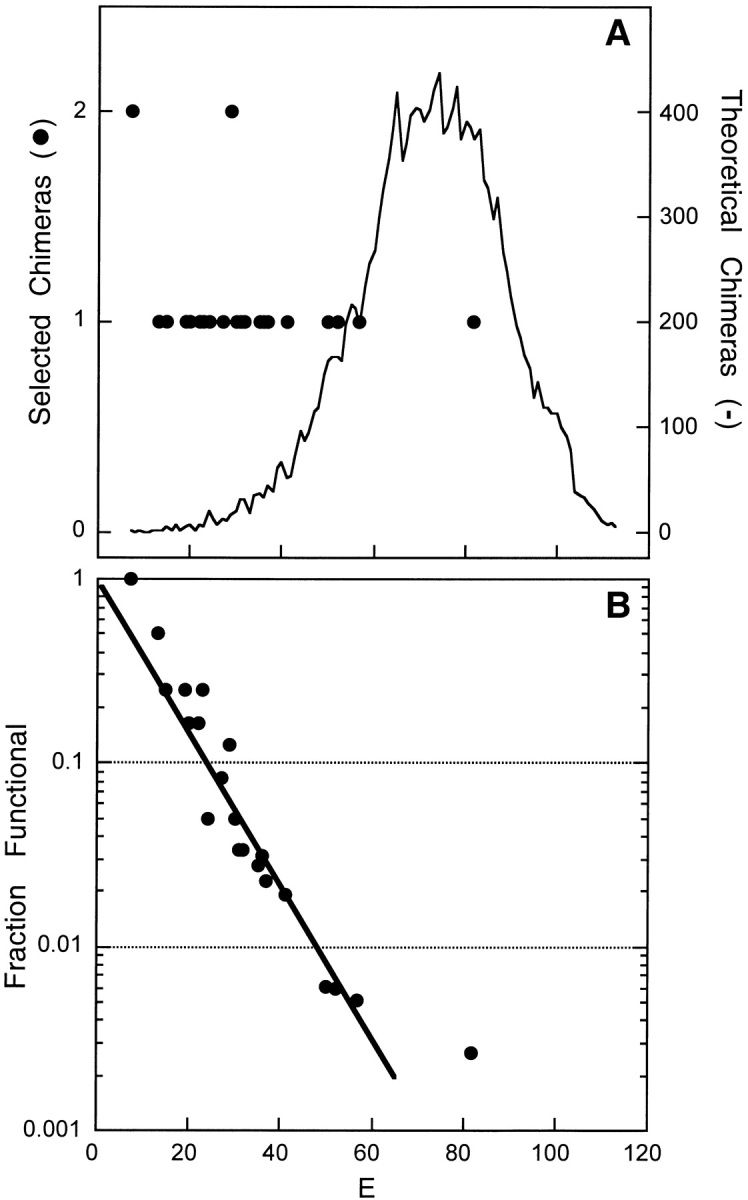
Figure 4.

Relationship between E and chimera function. (A) The disruption distribution of all possible chimeras (solid line) is compared with those discovered in the selection for activity (filled circles). (B) The fraction of theoretical chimeras identified as functional is shown for each E. The data were fit to Equation 1 using N = 322 to obtain the probability that a disruption leads to a nonfunctional chimera, fd = 0.095.
