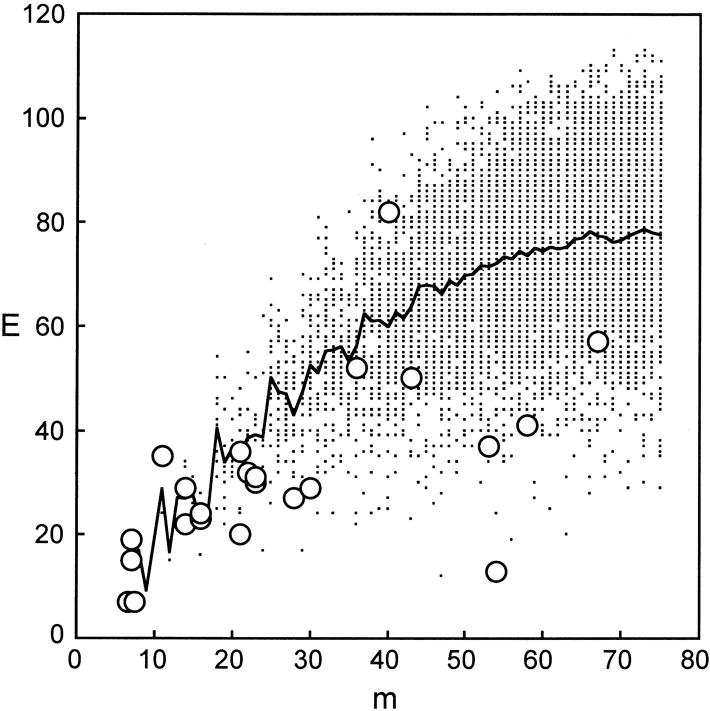
Figure 6.
E and m for all possible chimeras. At each level of mutation (m) where functional chimeras were obtained, the possible E values (filled circles), the mean E for all possible chimeras (solid line), and the E of functional chimeras (open circles) are shown. Highly mutated chimeras have significantly lower disruption than the mean.

