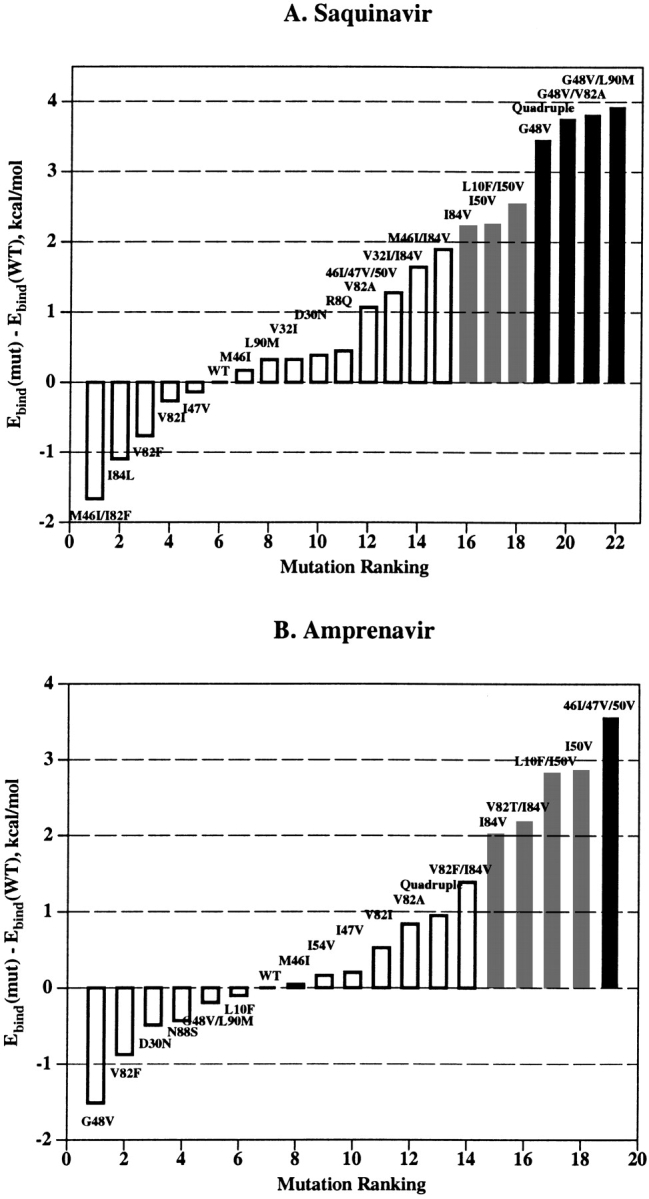
Figure 3.

Binding energy profiles for SQV (A) and APV (B). PR mutations described in the literature are ranked by the increasing ΔEbind. Predicted resistant (ΔEbind ≥ 2.0 kcal/mole) and highly resistant (ΔEbind ≥ 3.0 kcal/mole) mutants are shown as the gray and the black bars, respectively.
